
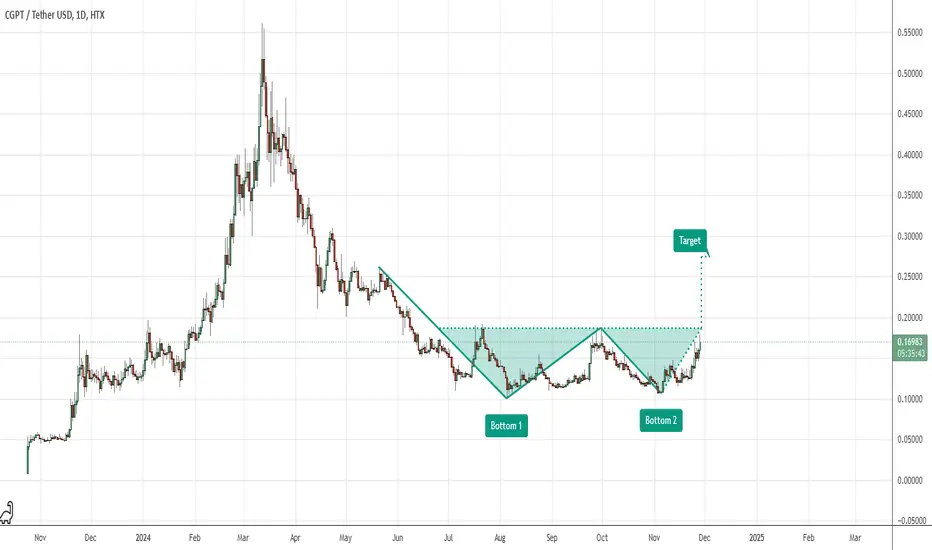
The chart depicts a double-bottom pattern, signaling a potential bullish reversal. The breakout above the neckline (~$0.17) confirms the pattern, with a target projected near $0.30 based on the height of the formation. Strong support lies at $0.15, while resistance levels exist around $0.22 and $0.25. Sustained momentum could achieve the target.

免责声明
这些信息和出版物并非旨在提供,也不构成TradingView提供或认可的任何形式的财务、投资、交易或其他类型的建议或推荐。请阅读使用条款了解更多信息。
免责声明
这些信息和出版物并非旨在提供,也不构成TradingView提供或认可的任何形式的财务、投资、交易或其他类型的建议或推荐。请阅读使用条款了解更多信息。