做空
CHATBTC - ANALYSIS
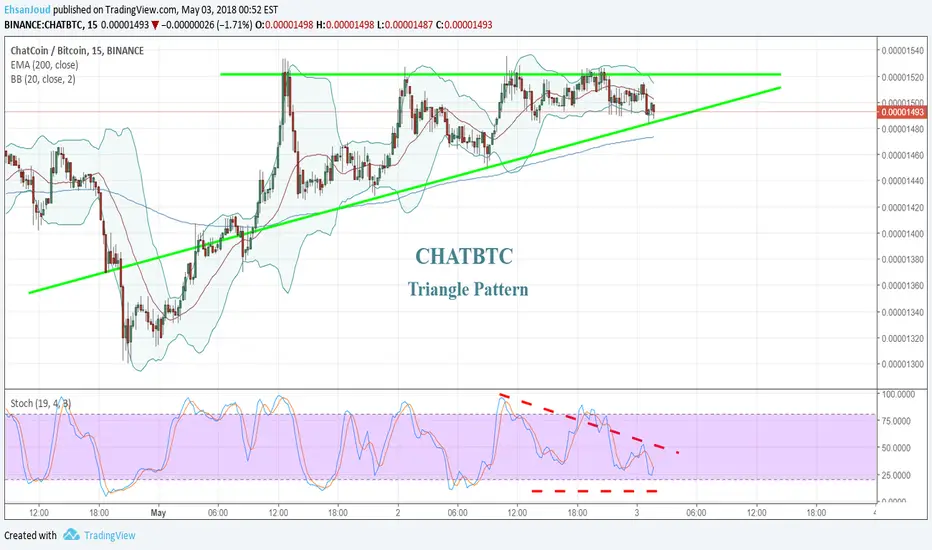
A Triangle Pattern with a multiple top in this CHATBTC 15 min chart is apparently about to break. Triangles are not fun to analyse, however, by looking at the STOCH chart at the bottom of the main chart, we can see that the Triangle can break lower than MA200.

免责声明
这些信息和出版物并非旨在提供,也不构成TradingView提供或认可的任何形式的财务、投资、交易或其他类型的建议或推荐。请阅读使用条款了解更多信息。
免责声明
这些信息和出版物并非旨在提供,也不构成TradingView提供或认可的任何形式的财务、投资、交易或其他类型的建议或推荐。请阅读使用条款了解更多信息。