做多
CHK Ascending Triangle Pattern
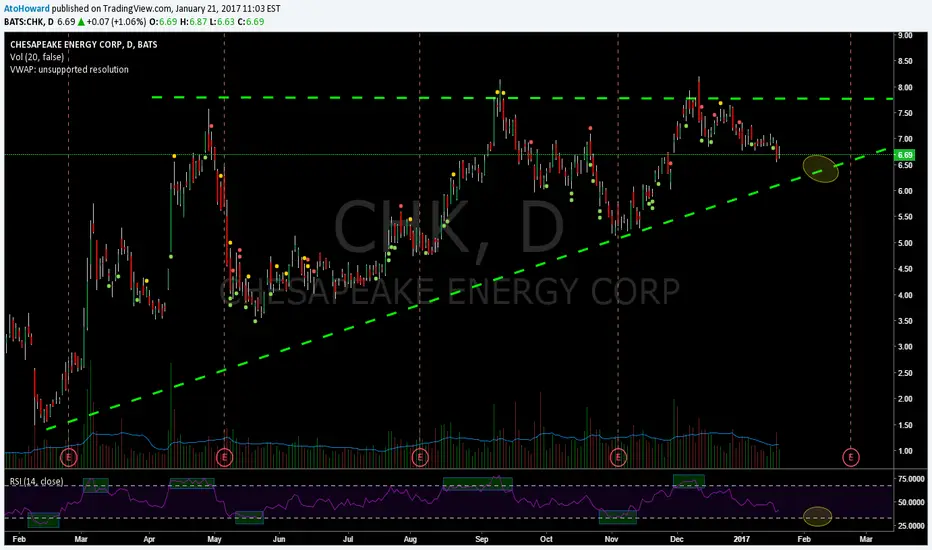
 CHK had strong downward channel trend that turned around in Feb 2016. Ascending triangle pattern formation, on monthly, weekly and daily timeframes, for long-term swing in price to break upper resistance @ ~$8.00 (this is daily chart).
Again, RSI has been so graceful in confirming possible short or long entries for the whole duration of the triangle's existence. RSI expected to drop with price (yellow ellipse on RSI chart); personally expect move to about $6.30 (yellow circle on chart proper), then turn around for upward swing to $8.00 resistance level.
If CHK can break $8.00, it can be a huge feast from there (possibly hit old $13 support level); it's a waiting game now. Wait for RSI confirmation and enter long around $6.50-$6.30.
However, outcome of earnings has potential to make or break chart pattern.

免责声明
这些信息和出版物并非旨在提供,也不构成TradingView提供或认可的任何形式的财务、投资、交易或其他类型的建议或推荐。请阅读使用条款了解更多信息。