
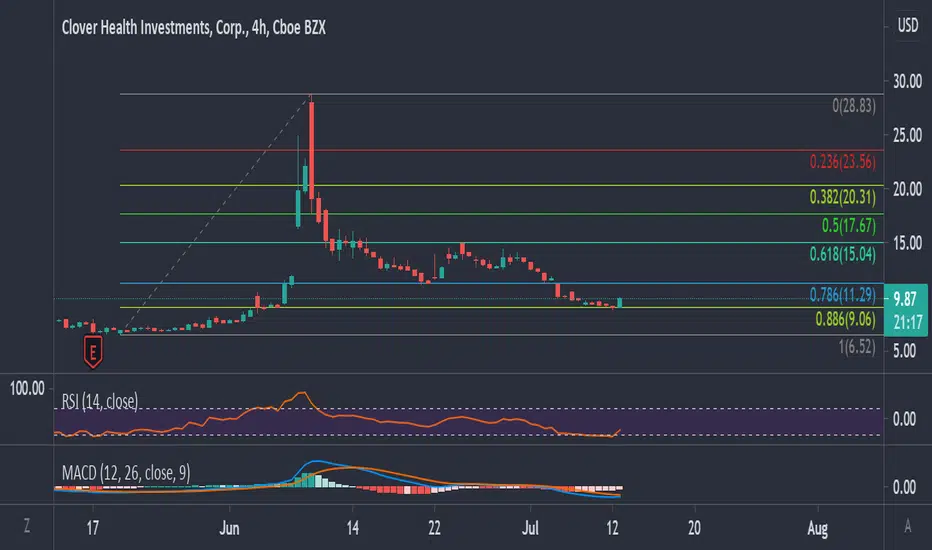
As you can clearly see in the chart, the golden mean ratio (.886) was well respected, and resulted in a positive retracement.
In addition to the .886 being respected - the area(s) between $8.90 -> $9 which were once strong resistance in the past, were regarded as support. This has flipped the bearish sentiment, into bullish.
If you missed the entry at $9, one can value this stock as a "sale" at any price under $11.80 level.
Pay close attention to the other Fibonacci levels, in addition to the psychological resistance levels (.00 & .50), as this asset pushes upward.
PLEASE LIKE/SUBSCRIBE IF YOU LIKED THIS TA!
(This is not financial advice, and I do hold long positions in this asset)
In addition to the .886 being respected - the area(s) between $8.90 -> $9 which were once strong resistance in the past, were regarded as support. This has flipped the bearish sentiment, into bullish.
If you missed the entry at $9, one can value this stock as a "sale" at any price under $11.80 level.
Pay close attention to the other Fibonacci levels, in addition to the psychological resistance levels (.00 & .50), as this asset pushes upward.
PLEASE LIKE/SUBSCRIBE IF YOU LIKED THIS TA!
(This is not financial advice, and I do hold long positions in this asset)

免责声明
这些信息和出版物并非旨在提供,也不构成TradingView提供或认可的任何形式的财务、投资、交易或其他类型的建议或推荐。请阅读使用条款了解更多信息。
免责声明
这些信息和出版物并非旨在提供,也不构成TradingView提供或认可的任何形式的财务、投资、交易或其他类型的建议或推荐。请阅读使用条款了解更多信息。