
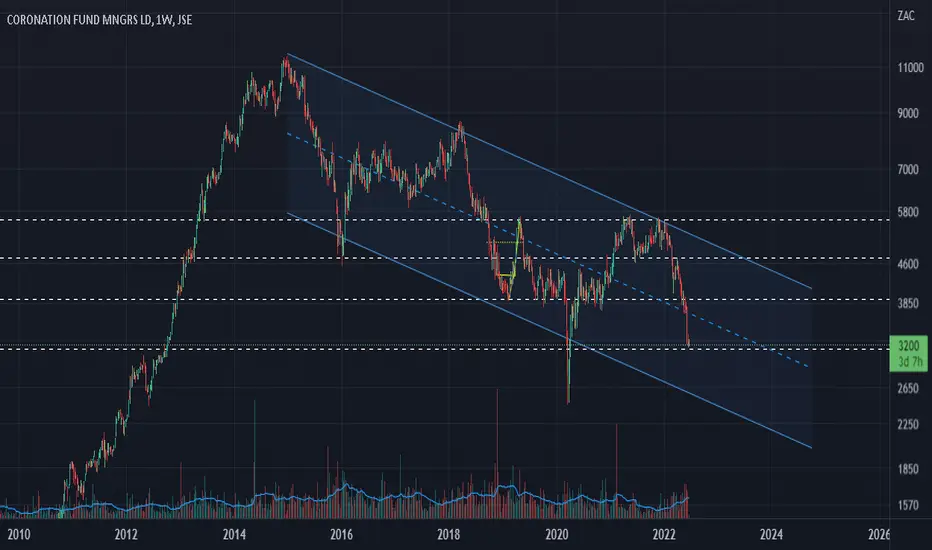
Is #CML #Coronation a buy at these levels?
Well on a weekly graph, over the past couple of years this share has traded in a descending channel. We are currently just below the mid-point of this channel.
Image 1
TD indicator on the weekly chart shows extreme oversold levels and we have reached a perfected 9.

Image 2
The stochastic indicator shows extreme oversold conditions.

Image 3
On an hourly graph the share is consolidating round R32.20, whilst the stochastic has pulled back a bit. This may set up the short term graph for a pop to the top, which will in turn initiate the turnaround on the weekly chart.

We might see Coronation running from here to close the ex-div gap at around R36.60.
Fundamentals:
Coronation is currently trading at a 7.5 PE and 13.5 DY dividend yield, which gives some protection if the share is to retest the 2020 lows as part of a capitulation turnaround.
Well on a weekly graph, over the past couple of years this share has traded in a descending channel. We are currently just below the mid-point of this channel.
Image 1
TD indicator on the weekly chart shows extreme oversold levels and we have reached a perfected 9.
Image 2
The stochastic indicator shows extreme oversold conditions.
Image 3
On an hourly graph the share is consolidating round R32.20, whilst the stochastic has pulled back a bit. This may set up the short term graph for a pop to the top, which will in turn initiate the turnaround on the weekly chart.
We might see Coronation running from here to close the ex-div gap at around R36.60.
Fundamentals:
Coronation is currently trading at a 7.5 PE and 13.5 DY dividend yield, which gives some protection if the share is to retest the 2020 lows as part of a capitulation turnaround.

免责声明
这些信息和出版物并非旨在提供,也不构成TradingView提供或认可的任何形式的财务、投资、交易或其他类型的建议或推荐。请阅读使用条款了解更多信息。