
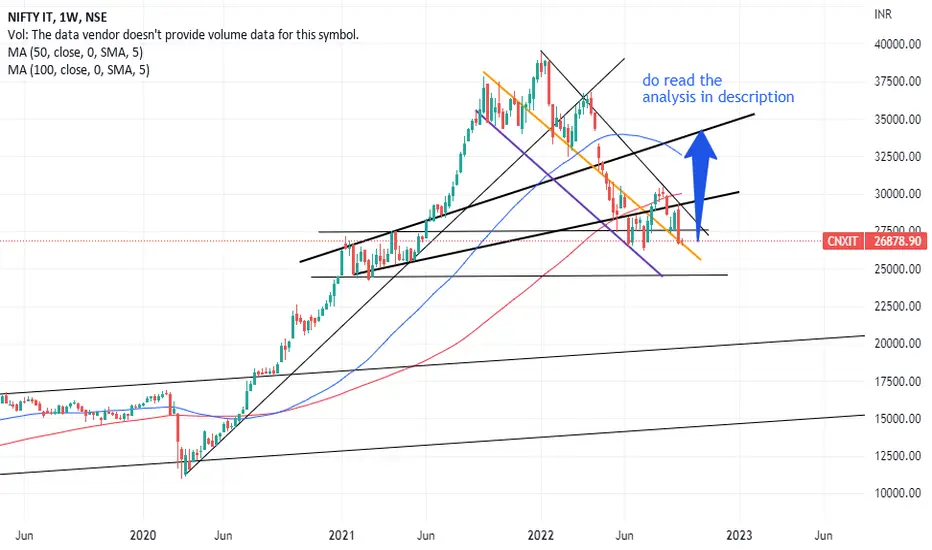
the dark purple lines shows, if the markets go further down, then it will touch 24533 level, which basically will not happen, because markets are recovering now, and the down fall of it sector, was for a particularly us fed hikes , and now the news has been factored in the indices.
coming next to the purple line(the dark orange line), markets will reach till that support only, if markets dont faces any crash or such.
the third line(black line), shows a breakout line to reach the level of 34533. the indice will show its bull run and will give a breakout to black line.
i have even shown the MA-50,100, for your analysis.
very bullish for the IT SECTOR AND ITS ALL STOCKS.
coming next to the purple line(the dark orange line), markets will reach till that support only, if markets dont faces any crash or such.
the third line(black line), shows a breakout line to reach the level of 34533. the indice will show its bull run and will give a breakout to black line.
i have even shown the MA-50,100, for your analysis.
very bullish for the IT SECTOR AND ITS ALL STOCKS.

免责声明
这些信息和出版物并非旨在提供,也不构成TradingView提供或认可的任何形式的财务、投资、交易或其他类型的建议或推荐。请阅读使用条款了解更多信息。