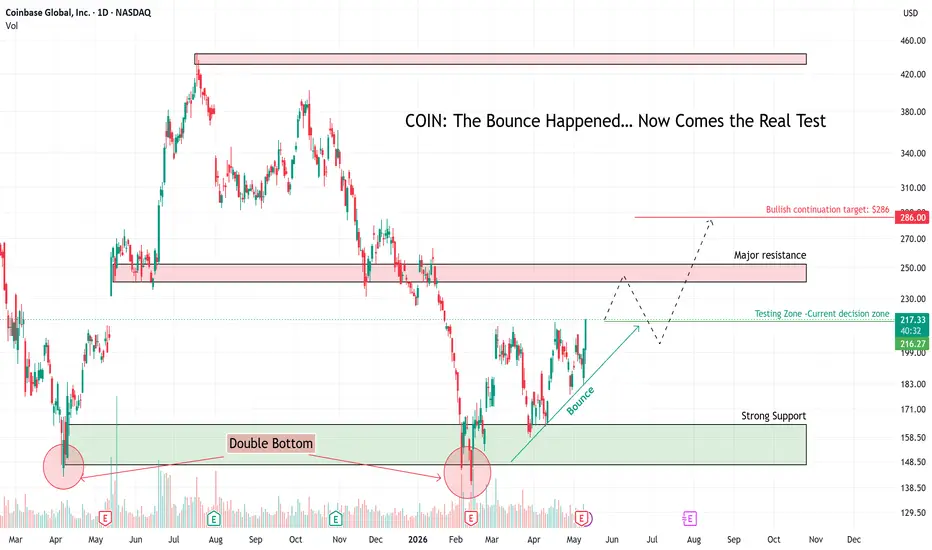
 COIN COIN is showing a strong recovery attempt after forming what looks like a clear double bottom structure near the $148–$160 support zone.
The bounce has already happened.
Now the real question is whether this move is only a short-term reaction from oversold levels, or the early stage of a larger trend reversal.
This is where many traders make the mistake of assuming that every strong bounce automatically means a new uptrend has started. In reality, a bounce only proves that buyers stepped in at support. A true reversal requires price to reclaim important resistance levels and hold above them.
Right now,
COIN is testing a key decision area around $215–$225. This zone matters because it is the first real test after the recovery from the double bottom. If price can continue holding above this area, the next major resistance sits near $240–$250.That $240–$250 zone is the most important level on this chart, in my opinion. It was previously a breakdown area, and now it could act as resistance. A clean breakout above that zone would be a stronger signal that
COIN is no longer just bouncing, but potentially rebuilding bullish structure.If that breakout happens, the next upside target I’m watching is around $286.
However, if COIN rejects the current decision zone or fails near $240–$250, I would not be surprised to see another pullback toward the $183–$190 area. That would be the first important support zone to watch if momentum weakens.
The educational lesson here is simple:
A double bottom can start the recovery, but resistance confirms the reversal.
For now, COIN has done the first part well. Buyers defended the macro support zone, price reacted strongly, and the chart is no longer making new lows. But the confirmation still depends on how price behaves near the next resistance levels.
My key levels:
Entry/watch zone: $215–$225
Major confirmation zone: $240–$250
Bullish continuation target: $286
Pullback support: $183–$190
Macro support: $148–$160
In my view,
COIN is no longer in the “dead bounce” area, but it is not fully confirmed as a trend reversal yet. The next move into resistance will be the real test.Disclaimer: This is not financial advice. This idea is for educational purposes only. Always do your own research and manage your risk.

相关出版物
免责声明
这些信息和出版物并非旨在提供,也不构成TradingView提供或认可的任何形式的财务、投资、交易或其他类型的建议或推荐。请阅读使用条款了解更多信息。