
Technical Analysis
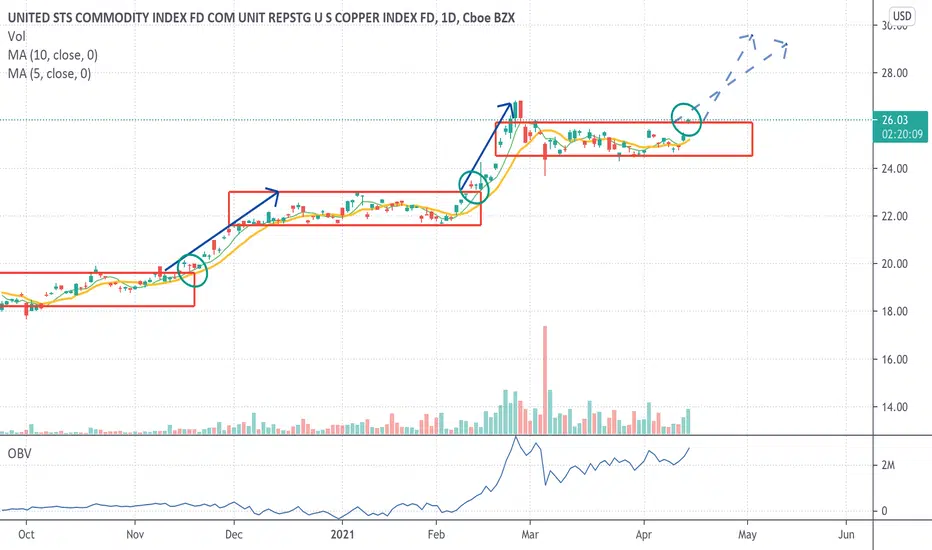
As you can see in the chart, every red square is showing a consolidation period, followed by a strong rally.
Today's action is showing strength as we are seeing a potential breakout, outside the 1-month consolidation period.
Trade setup
The light-blue arrows are potential measured moves. However, I would follow the 5sma or 10sma, as a stop-exit for 50% of your position.
Fundamental Analysis
There is some concern around inflation, all though the Fed maintains he believes it will be transitory.
Here is the way I follow inflation, which is a free chart by the Federal Reserve Economic Data:
fred.stlouisfed.org/series/T5YIE
Another way is with the TIP etf.
注释
Since the breakout, we have made a test of the last consolidation range and bounce back higher.Chart is looking great.

免责声明
这些信息和出版物并非旨在提供,也不构成TradingView提供或认可的任何形式的财务、投资、交易或其他类型的建议或推荐。请阅读使用条款了解更多信息。