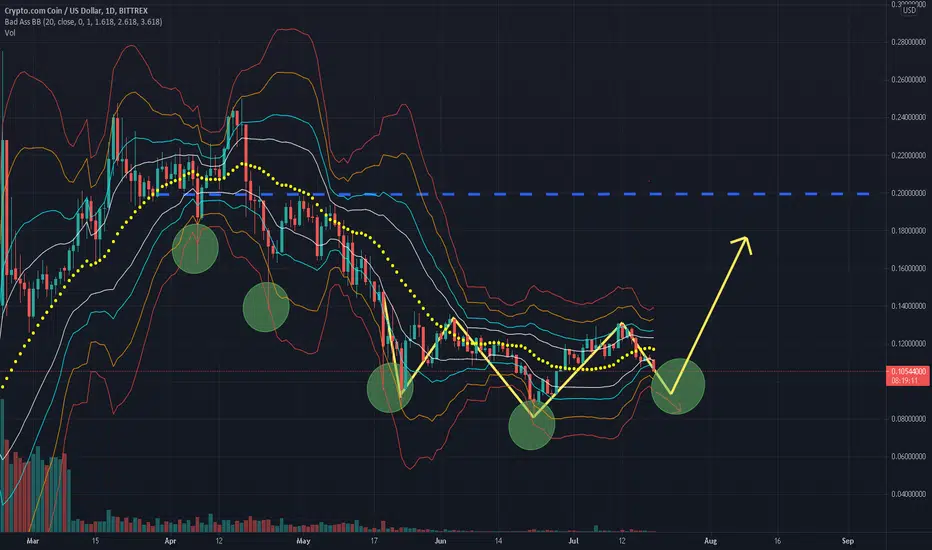
Inverse H & S pattern showing. Daily candles also look like they're inching toward the red lower Bollinger Band, indicating strong potential for a bounce. I believe we still need the right shoulder to connect with the left shoulder of the pattern at approx $0.09~ for the bounce to occur. The target for this pattern would be just below $0.20 where last resistance occurred.
Not financial advice, just my opinion.
Not financial advice, just my opinion.

免责声明
这些信息和出版物并非旨在提供,也不构成TradingView提供或认可的任何形式的财务、投资、交易或其他类型的建议或推荐。请阅读使用条款了解更多信息。