
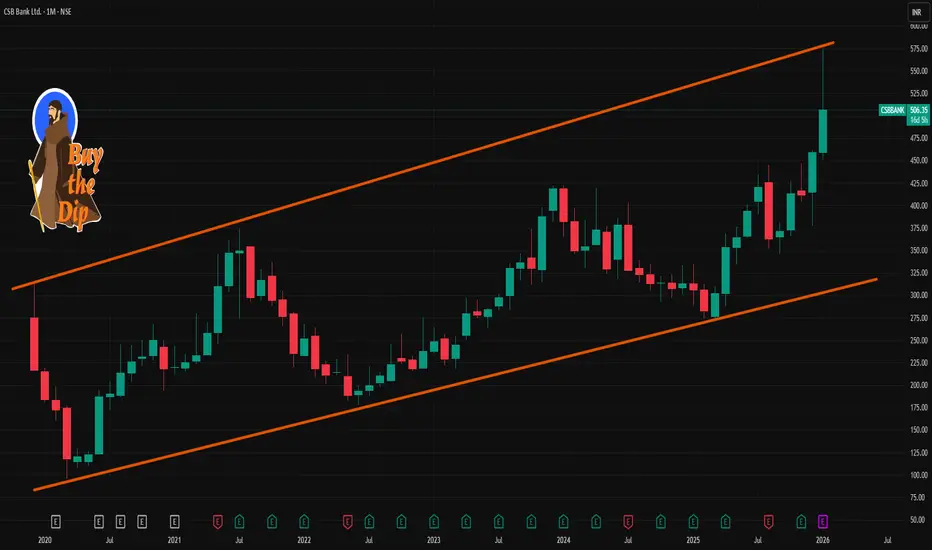
📌 Last Closing / Recent Price (delayed data)
• Around ₹505–₹520 range recently, showing strong short‑term price action.
🔍 Short‑Term (1‑Month) Key Levels
📈 Resistance Levels
These are levels where price may face selling pressure in short‑term moves:
R1: ~₹514–₹518 – first resistance zone.
R2: ~₹530–₹532 – next broader resistance if rally continues.
R3: ~₹543–₹557 – higher resistance area in 1‑month horizon.
Tactical View: Break above ~₹532–₹543 could signal continuation to higher short‑term highs.
📉 Support Levels
These are areas where dips may find buyers near:
S1: ~₹495–₹496 – first nearby support.
S2: ~₹484–₹485 – deeper support if dip extends.
S3: ~₹456–₹480 – broader support cluster if stronger correction.
Tactical View: A break below ~₹484–₹480 risks deeper consolidation.
🔄 Pivot Zone
Used by traders as dynamic center for short‑term bias:
Pivot: ~₹501–₹502 area — key reference for session trend.
Above pivot = bullish bias; below pivot = cautious/neutral in short horizon.
📊 Moving Averages (short‑term context)
Helpful for trend confirmation:
20‑day EMA/SMA: ~₹463–₹446 area — below current price => bullish trend.
50‑day SMA: ~₹433 — deeper trend support.
Current price is above these averages → trend remains bullish on 1‑month basis.
📈 Short‑Term Trade Bias (1‑month)
Bullish Scenario:
If price holds above pivot ~₹501–₹505 and support ~₹495, upside may test ₹518 → ₹532 → ₹543+.
Bearish Scenario (correction):
If price falls below ₹495 → ₹484, watch deeper support ₹474–₹456.
• Around ₹505–₹520 range recently, showing strong short‑term price action.
🔍 Short‑Term (1‑Month) Key Levels
📈 Resistance Levels
These are levels where price may face selling pressure in short‑term moves:
R1: ~₹514–₹518 – first resistance zone.
R2: ~₹530–₹532 – next broader resistance if rally continues.
R3: ~₹543–₹557 – higher resistance area in 1‑month horizon.
Tactical View: Break above ~₹532–₹543 could signal continuation to higher short‑term highs.
📉 Support Levels
These are areas where dips may find buyers near:
S1: ~₹495–₹496 – first nearby support.
S2: ~₹484–₹485 – deeper support if dip extends.
S3: ~₹456–₹480 – broader support cluster if stronger correction.
Tactical View: A break below ~₹484–₹480 risks deeper consolidation.
🔄 Pivot Zone
Used by traders as dynamic center for short‑term bias:
Pivot: ~₹501–₹502 area — key reference for session trend.
Above pivot = bullish bias; below pivot = cautious/neutral in short horizon.
📊 Moving Averages (short‑term context)
Helpful for trend confirmation:
20‑day EMA/SMA: ~₹463–₹446 area — below current price => bullish trend.
50‑day SMA: ~₹433 — deeper trend support.
Current price is above these averages → trend remains bullish on 1‑month basis.
📈 Short‑Term Trade Bias (1‑month)
Bullish Scenario:
If price holds above pivot ~₹501–₹505 and support ~₹495, upside may test ₹518 → ₹532 → ₹543+.
Bearish Scenario (correction):
If price falls below ₹495 → ₹484, watch deeper support ₹474–₹456.

Contact Knowledgehub for a detailed consultation: Dm on WhatsApp: [wa.link/a2o0kz]-
Phone No: [+91 93102 26243]-
Email: [tradingviewknowledgehub@gmail.com]---
-- Let’s achieve success together!
Phone No: [+91 93102 26243]-
Email: [tradingviewknowledgehub@gmail.com]---
-- Let’s achieve success together!
相关出版物
免责声明
这些信息和出版物并非旨在提供,也不构成TradingView提供或认可的任何形式的财务、投资、交易或其他类型的建议或推荐。请阅读使用条款了解更多信息。
Contact Knowledgehub for a detailed consultation: Dm on WhatsApp: [wa.link/a2o0kz]-
Phone No: [+91 93102 26243]-
Email: [tradingviewknowledgehub@gmail.com]---
-- Let’s achieve success together!
Phone No: [+91 93102 26243]-
Email: [tradingviewknowledgehub@gmail.com]---
-- Let’s achieve success together!
相关出版物
免责声明
这些信息和出版物并非旨在提供,也不构成TradingView提供或认可的任何形式的财务、投资、交易或其他类型的建议或推荐。请阅读使用条款了解更多信息。