
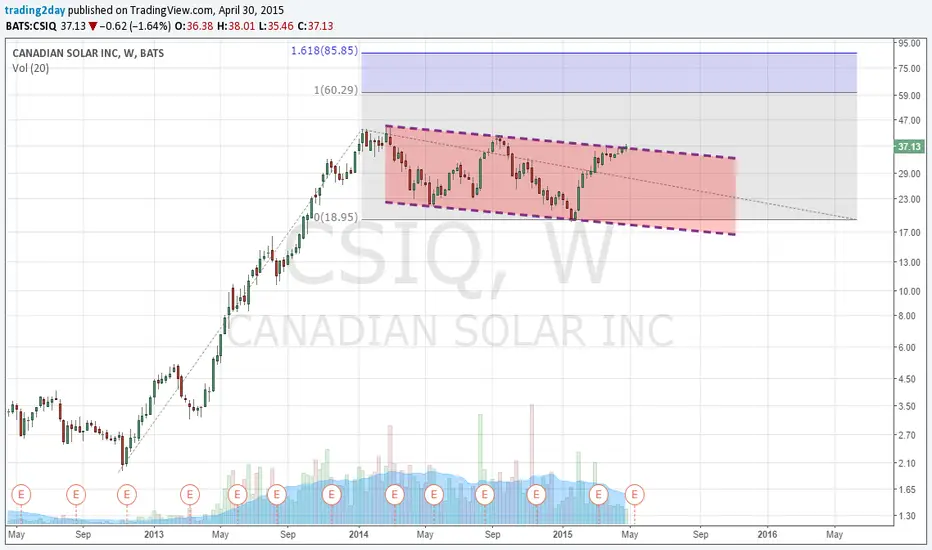
The weekly chart in CSIQ is a bullish flag. Current price action shows that price is near breaking out above the flag. Conservative target is 50-55$ while an equal leg upward to the previous upward move can bring the share price towards 60$. The sideways consolidation in CSIQ is most probably over. Short-term support at 35$ and at 33$. A break below these levels could signal a fake breakout and a reversal could bring price towards 26$-28$.

免责声明
这些信息和出版物并非旨在提供,也不构成TradingView提供或认可的任何形式的财务、投资、交易或其他类型的建议或推荐。请阅读使用条款了解更多信息。
免责声明
这些信息和出版物并非旨在提供,也不构成TradingView提供或认可的任何形式的财务、投资、交易或其他类型的建议或推荐。请阅读使用条款了解更多信息。