DENT - Update
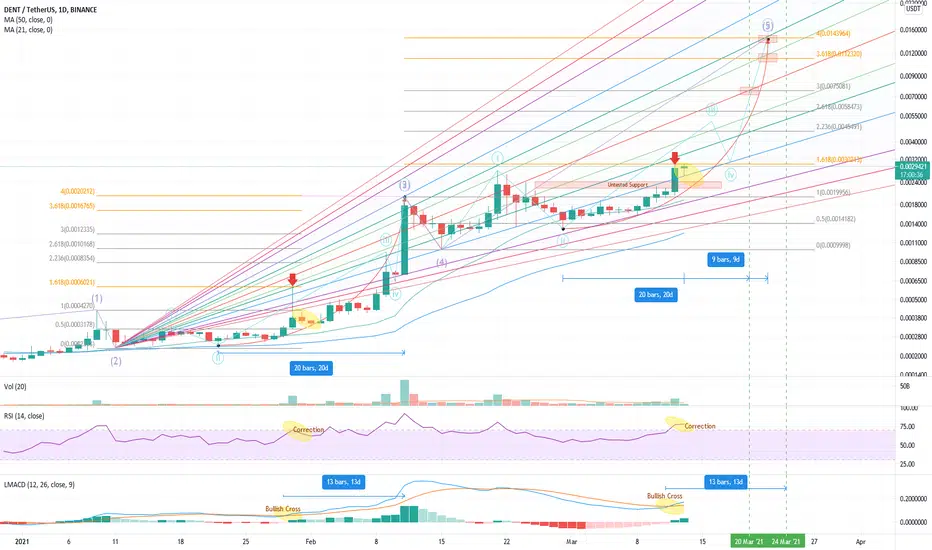
This is an update on my previous study of DENT. In this update, I've corrected for some inaccuracies in the positioning of the Fibonacci projections, and have dug in a little more on identifying the correspondences of the previous rally. In that there are a few artifacts in the chart that provide some confidence in the positioning of DENT to repeat (or at least approach) the scale of the previous rally, namely:
1) The Bullish Cross on the LMACD; and
2) The correction from the 1.618 Fibonacci projection line (red arrows)
Notably, there timing of the previous peak was 20 days from the prior low and 13 days from the cross of the LMACD. If consistently replicating this action, this puts the next peak between March 20 and March 24, or around March 22.
Can it make the 4x Fibonacci projection to $0.014, or will it peak $0.01 on the 3.618x level? Let me know what you think in the comments.
1) The Bullish Cross on the LMACD; and
2) The correction from the 1.618 Fibonacci projection line (red arrows)
Notably, there timing of the previous peak was 20 days from the prior low and 13 days from the cross of the LMACD. If consistently replicating this action, this puts the next peak between March 20 and March 24, or around March 22.
Can it make the 4x Fibonacci projection to $0.014, or will it peak $0.01 on the 3.618x level? Let me know what you think in the comments.

免责声明
这些信息和出版物并非旨在提供,也不构成TradingView提供或认可的任何形式的财务、投资、交易或其他类型的建议或推荐。请阅读使用条款了解更多信息。