
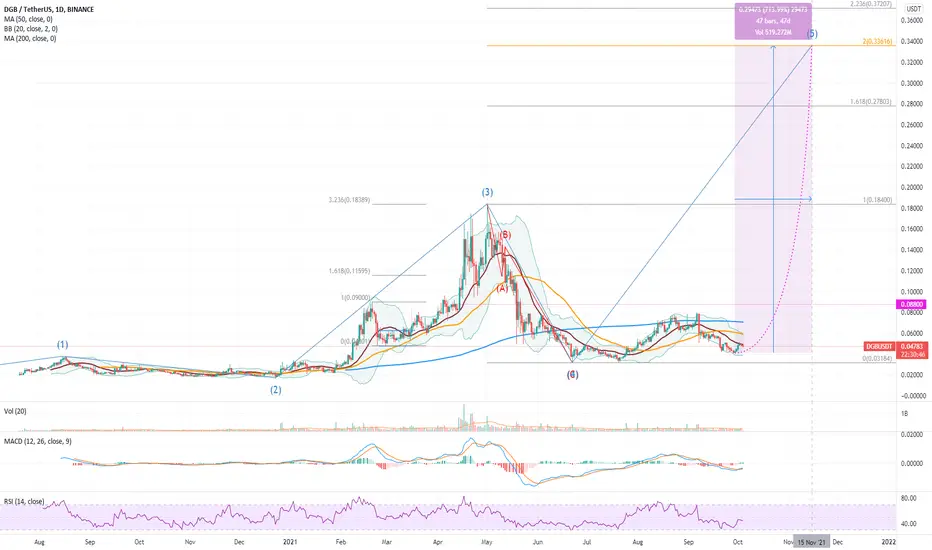
A review of the posture of Digibyte, following the completion of three corrections, printing three successively higher-lows.
In terms of Elliott Wave analysis, there are two interpretations:
Either case is bullish and is well supported by the MACD crossing bullish and the RSI sitting comfortably in neutral territory. Looking at the the Fibonacci projection of the correction on this standard scale chart and two targets present themselves:
Of course there are higher levels, but they will become exponentially less likely the longer DGB remains under $0.185.
What do you think? How high can DGB rally to complete this next impulse wave higher?
In terms of Elliott Wave analysis, there are two interpretations:
- DGB has now completed a Wave 4 and commenced a Wave 5; or
- DGB has completed a Wave 2 and just commenced a Wave 3.
Either case is bullish and is well supported by the MACD crossing bullish and the RSI sitting comfortably in neutral territory. Looking at the the Fibonacci projection of the correction on this standard scale chart and two targets present themselves:
- $0.278 at the 1.618 resistance line
- $0.336 at the 2.0 resistance line
Of course there are higher levels, but they will become exponentially less likely the longer DGB remains under $0.185.
What do you think? How high can DGB rally to complete this next impulse wave higher?

免责声明
这些信息和出版物并非旨在提供,也不构成TradingView提供或认可的任何形式的财务、投资、交易或其他类型的建议或推荐。请阅读使用条款了解更多信息。
免责声明
这些信息和出版物并非旨在提供,也不构成TradingView提供或认可的任何形式的财务、投资、交易或其他类型的建议或推荐。请阅读使用条款了解更多信息。