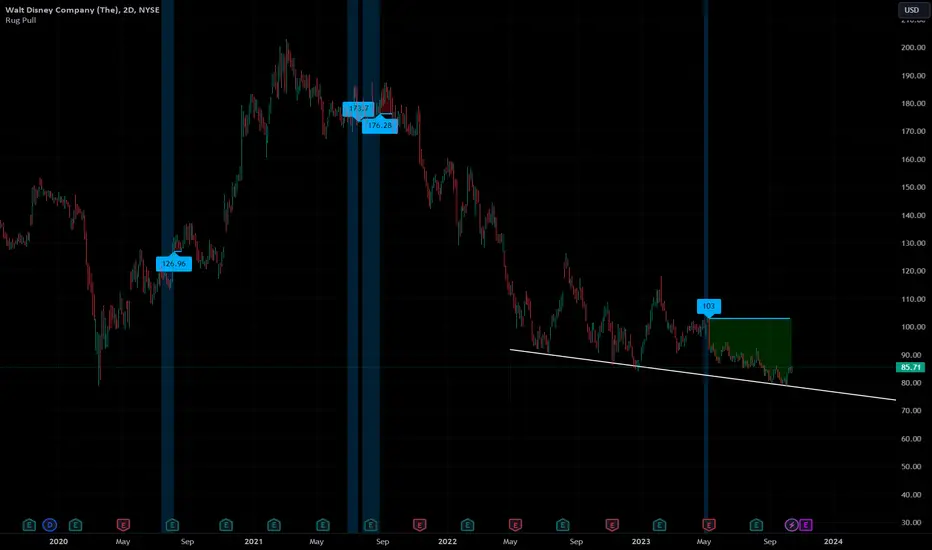
 DIS has certainly seen better days as it has spent the better part of the last 2 years with price action slowly trickling downwards.
That being said, a magical opportunity appears to be presenting itself.
We see an active rug pull event has kicked off on the 2D chart with an upside target of $103. This represents an upside of approximately 20% from current levels.
In confluence with this, we see that price is currently contained within a downwards channel with the upper line of this channel conveniently at, you guessed it, $103.
Furthermore, price appears to be breaking out of a falling wedge within the aforementioned channel and price has bounced off of prior COVID lows.
As a cherry on top, there appears to be massive bullish divergence building on the monthly timeframe with a pending EMA crossover of the RSI.
All signs pointing to potential near-future bullish movements; however, long-term direction of
DIS remains cloudy.Disclaimer:
Any information contained within this post does not constitute any financial, investment, or trading advice. Trade or invest at your own risk.

免责声明
这些信息和出版物并非旨在提供,也不构成TradingView提供或认可的任何形式的财务、投资、交易或其他类型的建议或推荐。请阅读使用条款了解更多信息。
免责声明
这些信息和出版物并非旨在提供,也不构成TradingView提供或认可的任何形式的财务、投资、交易或其他类型的建议或推荐。请阅读使用条款了解更多信息。