
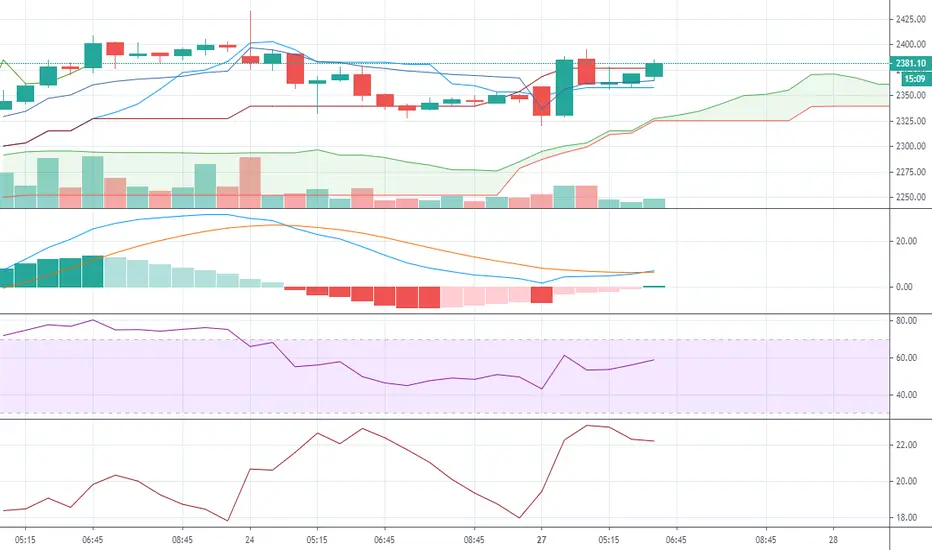
Intraday Cash Buy DIVISLAB @2364.00-2371 SL 2316.7 TGT 2452
It has good momentum with MACD cross over and 15 min chart ha TK cross over as well.
It has good momentum with MACD cross over and 15 min chart ha TK cross over as well.
交易开始
Those holding add more and those missed create fresh long. Divi’s Lab is one of the top-performing candidates from the pharma sector. In the ratio chart, the price has managed to breakout above the downsloping trendline indicating outperformance of Divi’s Lab in relation to Nifty Pharma Index. In the point & figure chart, the price has taken support at the upward sloping trendline and a fresh breakout buy signal is also triggered, suggesting bullish undertone. Go long in Divi’s Lab in the Rs 2,410-2,430 range with a stop loss at Rs 2,365 for targets of Rs 2,500 and Rs 2,560.交易结束:到达目标
First TGT hit but it looks good for more.
免责声明
这些信息和出版物并非旨在提供,也不构成TradingView提供或认可的任何形式的财务、投资、交易或其他类型的建议或推荐。请阅读使用条款了解更多信息。
免责声明
这些信息和出版物并非旨在提供,也不构成TradingView提供或认可的任何形式的财务、投资、交易或其他类型的建议或推荐。请阅读使用条款了解更多信息。