
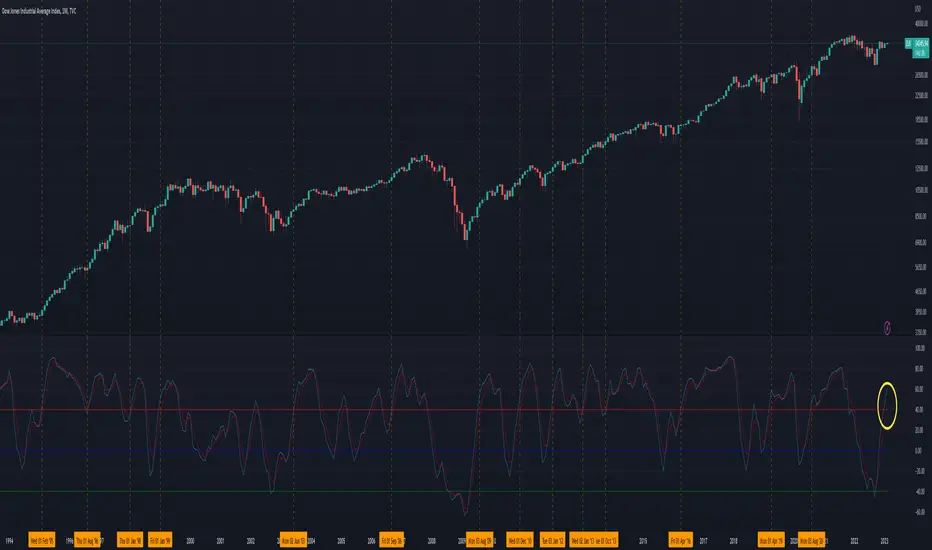
It has been over two years since the COVID crash and despite people sharing 2008 fractal patterns, traders' expectations of a stock market crash have yet to be realized. In fact, recent chart patterns for the Dow Jones and NAS100 suggest that bottoming patterns are emerging. For further technical analysis of the NAS100, please refer to:
tradingview.com/chart/NAS100USD/StFTwnZC-NAS100-Signature-W-pattern/.
Notably, the Dow Jones has recently given a buy signal on stochastic momentum, though it is advisable to wait for monthly closure to confirm.
Historical analysis indicates that whenever both signal lines close above the 40 level, some sort of bull market emerges. This signal has fired off 13 times since 1995, producing an average 24% move to the upside, with an average time frame of 276 days from signal to local top. Assuming a 24% move from current levels, the DOW is expected to reach 1.618 42268.

Based on the chart evidence, it appears that the probability of a rally to the upside is higher than that of a 2008-style stock market crash, at least not within the next six months, barring any unforeseeable black swan event.
tradingview.com/chart/NAS100USD/StFTwnZC-NAS100-Signature-W-pattern/.
Notably, the Dow Jones has recently given a buy signal on stochastic momentum, though it is advisable to wait for monthly closure to confirm.
Historical analysis indicates that whenever both signal lines close above the 40 level, some sort of bull market emerges. This signal has fired off 13 times since 1995, producing an average 24% move to the upside, with an average time frame of 276 days from signal to local top. Assuming a 24% move from current levels, the DOW is expected to reach 1.618 42268.
Based on the chart evidence, it appears that the probability of a rally to the upside is higher than that of a 2008-style stock market crash, at least not within the next six months, barring any unforeseeable black swan event.

免责声明
这些信息和出版物并非旨在提供,也不构成TradingView提供或认可的任何形式的财务、投资、交易或其他类型的建议或推荐。请阅读使用条款了解更多信息。