
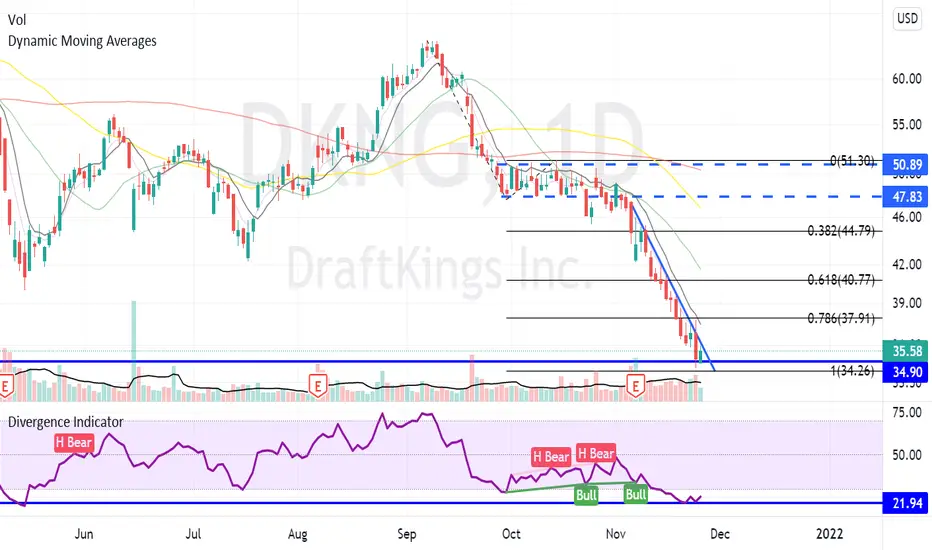
DKNG has suffered from massive selling. The stock fell from its highs of $65 in September, to about $50. It consolidated for a month in a parallel channel and then broke below. Measuring the downside move from the bearflag/ABC pattern places DKNG at current levels ($35). We are currently sitting at a support level that was created back in October/November of 2020. Additionally, RSI reads that we are overextended to the downside. The last time we had a reading this low was at the same support from Oct/Nov. DKNG bounced about 40% from those lows. If we begin to close above this steep downtrend channel that we are in, we could look for a retest of the 0.618 fib level which happens to be around $40.
订单已取消
Looks like this never broke significantly above the channel so no trade was taken.
免责声明
这些信息和出版物并非旨在提供,也不构成TradingView提供或认可的任何形式的财务、投资、交易或其他类型的建议或推荐。请阅读使用条款了解更多信息。