
DogeCoin (DOGE) technical analysis:
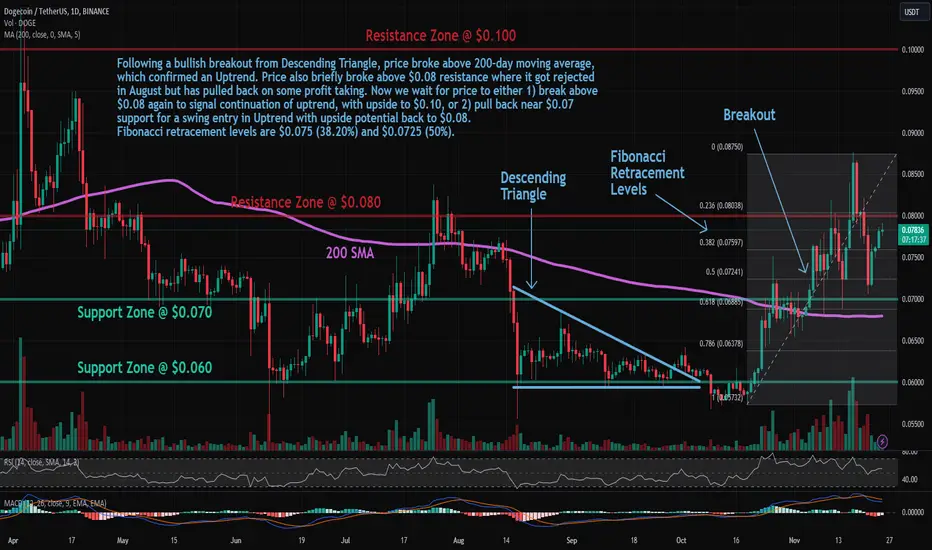
Trade setup: Following a bullish breakout from Descending Triangle, price broke above 200-day moving average, which confirmed an Uptrend. Price also briefly broke above $0.08 resistance where it got rejected in August but has pulled back on some profit taking. Now we wait for price to either 1) break above $0.08 again to signal continuation of uptrend, with upside to $0.10, or 2) pull back near $0.07 support for a swing entry in Uptrend with upside potential back to $0.08. Fibonacci retracement levels are $0.075 (38.20%) and $0.0725 (50%).
Trend: Uptrend across all time horizons (Short- Medium- and Long-Term).
Momentum is Mixed as MACD Line is below MACD Signal Line (Bearish) but RSI > 55 (Bullish). MACD Histogram bars are rising, which suggests that momentum could be nearing another upswing.
Support and Resistance: Nearest Support Zone is $0.070 (previous resistance), then $0.060. The nearest Resistance Zone is $0.08, then $0.10.
Trade setup: Following a bullish breakout from Descending Triangle, price broke above 200-day moving average, which confirmed an Uptrend. Price also briefly broke above $0.08 resistance where it got rejected in August but has pulled back on some profit taking. Now we wait for price to either 1) break above $0.08 again to signal continuation of uptrend, with upside to $0.10, or 2) pull back near $0.07 support for a swing entry in Uptrend with upside potential back to $0.08. Fibonacci retracement levels are $0.075 (38.20%) and $0.0725 (50%).
Trend: Uptrend across all time horizons (Short- Medium- and Long-Term).
Momentum is Mixed as MACD Line is below MACD Signal Line (Bearish) but RSI > 55 (Bullish). MACD Histogram bars are rising, which suggests that momentum could be nearing another upswing.
Support and Resistance: Nearest Support Zone is $0.070 (previous resistance), then $0.060. The nearest Resistance Zone is $0.08, then $0.10.

免责声明
这些信息和出版物并非旨在提供,也不构成TradingView提供或认可的任何形式的财务、投资、交易或其他类型的建议或推荐。请阅读使用条款了解更多信息。