
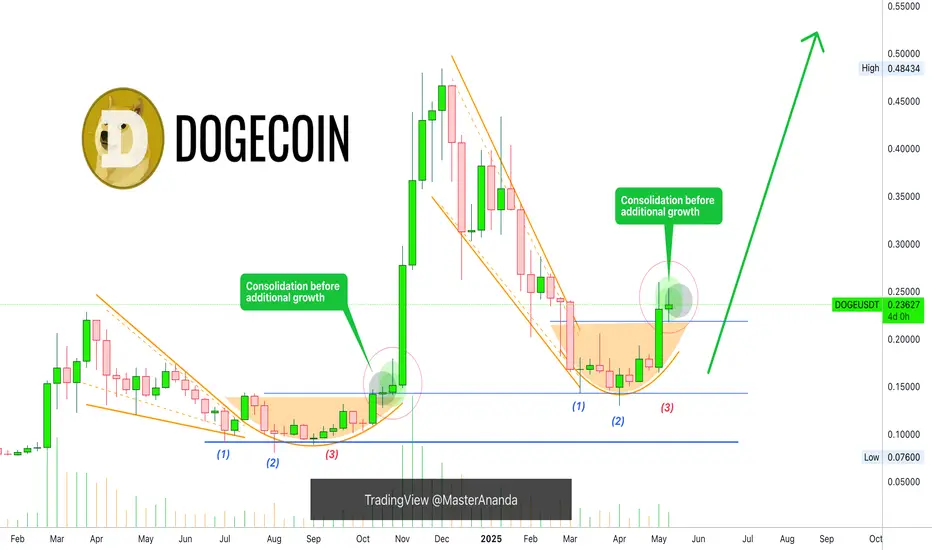
Repeating patterns are great because you can easily predict the future by studying them.
Good...
Dogecoin produced a peak in March 2024 and starts a decent. This descent creates a sequence of lows marked 1,2,3 on the chart. This ends up as a rounded bottom. As soon as the action recovers above the baseline of the rounded bottom, there is some consolidation and then massive growth. The highest prices in several years. The situation is very similar today.
Dogecoin produced a peak in December 2024 and then starts a descent. This descent creates the bottom pattern shown on the chart. The market is already bullish as all the bearish action since February has been removed. DOGEUSDT moves now as if it were February 2025. March and April where the months that produced the final market shakeout (flush) before the 2025 bull market cycle and wave.
Right now we can see some consolidation based on the weekly timeframe, very short, followed by additional growth. The biggest wave since 2021. Something awesome.
Are you ready?
I hope you are...
Namaste.

💯 Trading signals (results)
— Late 2026👇
t.me/masteranandatrades/9279
🔥 10-25X Leverage
—Trade-numbers:
t.me/masteranandatrades/9271
✅ PREMIUM &Content
—One-Time Payment
t.me/lamatrades/4 (🔝 since 2017)
— Late 2026👇
t.me/masteranandatrades/9279
🔥 10-25X Leverage
—Trade-numbers:
t.me/masteranandatrades/9271
✅ PREMIUM &Content
—One-Time Payment
t.me/lamatrades/4 (🔝 since 2017)
相关出版物
免责声明
这些信息和出版物并非旨在提供,也不构成TradingView提供或认可的任何形式的财务、投资、交易或其他类型的建议或推荐。请阅读使用条款了解更多信息。