
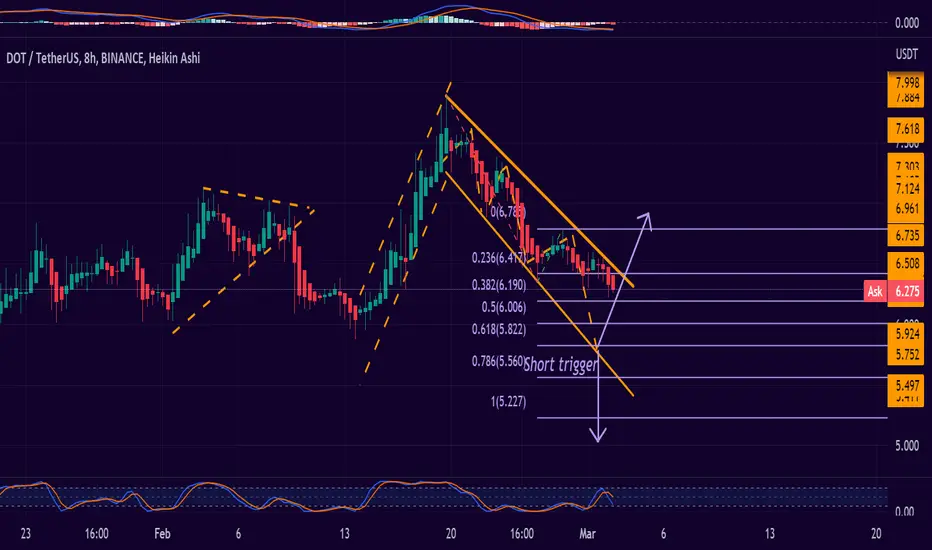
DOTUSDT 8H
The DOT USDT chart in an 8-hour period continues to indicate the bearish channel. It could break the upward channel and leave this bearish trend, but if it drops from the level of 5,833 then we will have a SHORT TRIGGER, that is a trigger for the shorts.
On the M45 chart, we will see the supports and resistances:
DOTUSDT M45:
S1:6,215
S2: 6,145
R1: 6,331
R2: 6,356
The DOT USDT chart in an 8-hour period continues to indicate the bearish channel. It could break the upward channel and leave this bearish trend, but if it drops from the level of 5,833 then we will have a SHORT TRIGGER, that is a trigger for the shorts.
On the M45 chart, we will see the supports and resistances:
DOTUSDT M45:
S1:6,215
S2: 6,145
R1: 6,331
R2: 6,356

Renato Ulianov | Market Analysis & Trading
YouTube: youtube.com/@TradewithRenatoUlianov
Disclaimer: All content is for educational and informational purposes only and does not constitute financial advice.
YouTube: youtube.com/@TradewithRenatoUlianov
Disclaimer: All content is for educational and informational purposes only and does not constitute financial advice.
免责声明
这些信息和出版物并非旨在提供,也不构成TradingView提供或认可的任何形式的财务、投资、交易或其他类型的建议或推荐。请阅读使用条款了解更多信息。
Renato Ulianov | Market Analysis & Trading
YouTube: youtube.com/@TradewithRenatoUlianov
Disclaimer: All content is for educational and informational purposes only and does not constitute financial advice.
YouTube: youtube.com/@TradewithRenatoUlianov
Disclaimer: All content is for educational and informational purposes only and does not constitute financial advice.
免责声明
这些信息和出版物并非旨在提供,也不构成TradingView提供或认可的任何形式的财务、投资、交易或其他类型的建议或推荐。请阅读使用条款了解更多信息。