
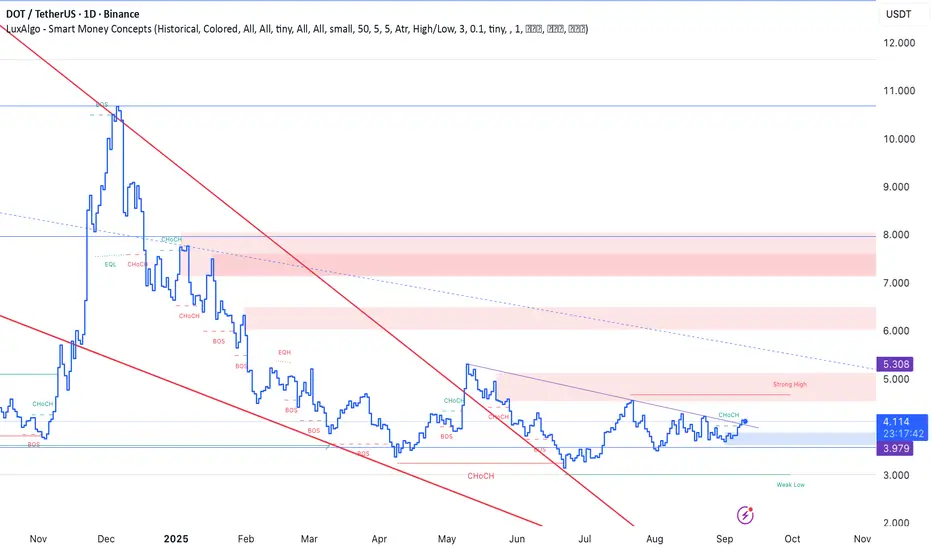
DOT Technical Outlook
On the weekly timeframe, DOT has confirmed a breakout from its long-term downtrend, followed by a successful retest. This establishes a solid technical foundation, with confluence now forming between the weekly and daily structures.
On the daily chart, price action has moved decisively above the previous bearish zone, signaling renewed momentum. In the short term, the key resistance levels to monitor are $5, $6, and $8. A sustained breakout above these thresholds would provide confirmation for a broader bullish scenario.
From a technical perspective, the upward trend has been validated. The next catalyst for continuation will likely come from upcoming market developments and potential positive news flow, which could act as triggers to remove remaining resistance barriers.
Overall, the technical setup suggests that DOT is positioned for further upside, with a constructive outlook in the near to medium term.
交易开始
The engine is heating up. The train is leaving the station! Fasten your seatbelts!
免责声明
这些信息和出版物并非旨在提供,也不构成TradingView提供或认可的任何形式的财务、投资、交易或其他类型的建议或推荐。请阅读使用条款了解更多信息。