
Description:
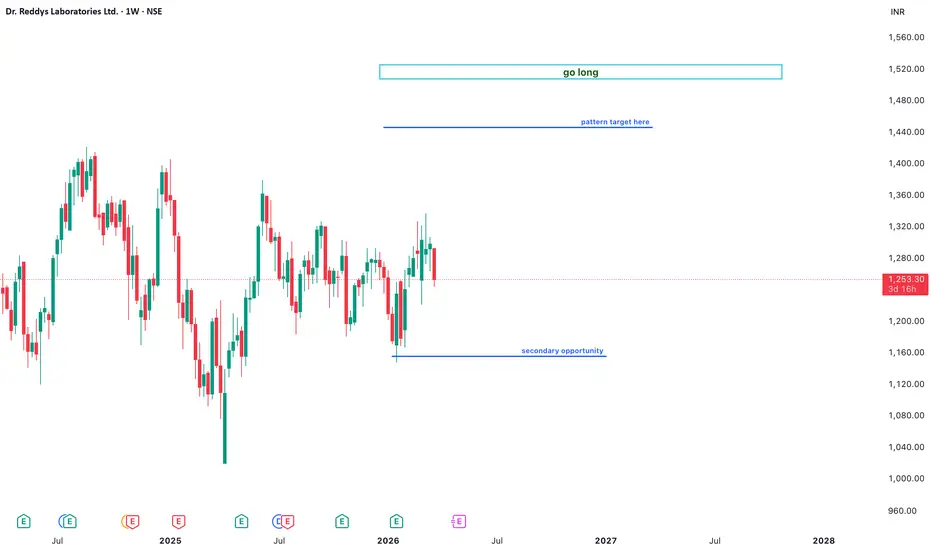
Analyzing the weekly structure of Dr. Reddy's Laboratories Ltd., the price action suggests a consolidating phase with a clear roadmap for bullish continuation.
Technical Observations:
Secondary Accumulation Zone: As marked on the chart, the lower level around 1,160 is a critical support area. "If the market reaches this level, it presents a high-probability secondary opportunity" for long positions.
Pattern Objective: The immediate resistance flip points toward a Pattern Target near the 1,450 zone.
The Long-Term Horizon: A decisive breakout above the pattern target clears the path to "Go Long" toward the ultimate objective zone near 1,520.
Execution Plan:
Bias: Bullish.
Entry Logic: Looking for accumulation at the support or a breakout above the immediate hurdle.
Target: Aiming for the 1,450 - 1,520 range in the mid-to-long term.
Disclaimer: Educational analysis based on weekly price action. Not financial advice.
Analyzing the weekly structure of Dr. Reddy's Laboratories Ltd., the price action suggests a consolidating phase with a clear roadmap for bullish continuation.
Technical Observations:
Secondary Accumulation Zone: As marked on the chart, the lower level around 1,160 is a critical support area. "If the market reaches this level, it presents a high-probability secondary opportunity" for long positions.
Pattern Objective: The immediate resistance flip points toward a Pattern Target near the 1,450 zone.
The Long-Term Horizon: A decisive breakout above the pattern target clears the path to "Go Long" toward the ultimate objective zone near 1,520.
Execution Plan:
Bias: Bullish.
Entry Logic: Looking for accumulation at the support or a breakout above the immediate hurdle.
Target: Aiming for the 1,450 - 1,520 range in the mid-to-long term.
Disclaimer: Educational analysis based on weekly price action. Not financial advice.

免责声明
这些信息和出版物并非旨在提供,也不构成TradingView提供或认可的任何形式的财务、投资、交易或其他类型的建议或推荐。请阅读使用条款了解更多信息。
免责声明
这些信息和出版物并非旨在提供,也不构成TradingView提供或认可的任何形式的财务、投资、交易或其他类型的建议或推荐。请阅读使用条款了解更多信息。