
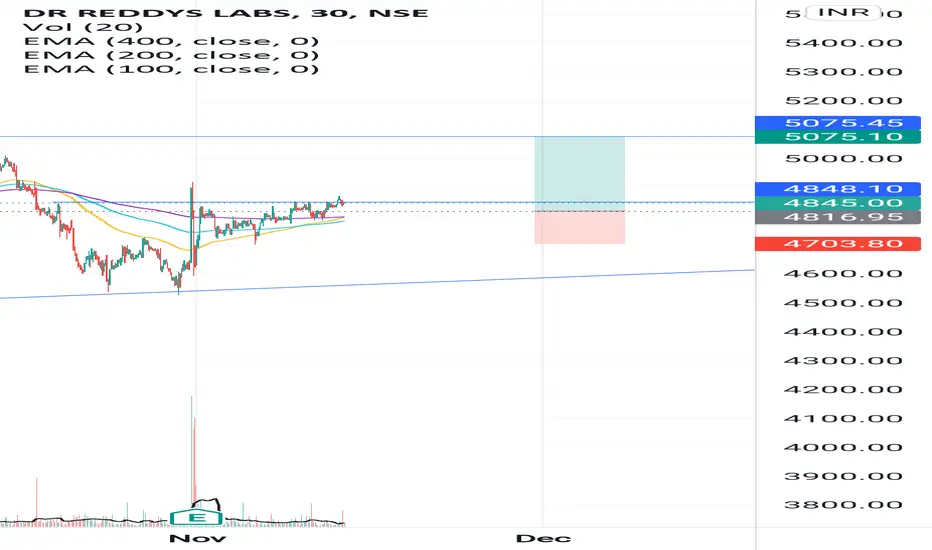
Hi Trading View Family, Today I have found very intersting chart of DR REDDY, here we can see that on 30min TF we have found 100EMA,200EMA crossing each other when 100EMA cross 400EMA ,We can generate a buy,As100EMA,200EMA,400EMA is forming straight line on chart and then crossing which shows that price has been consolidate and now can go away from MOVING AVERAGE to give movement.So a high probability buy signal will be triggered when 100EMA CROSSES 200EMA,400EMA, and target of 1:2 can be achived.

免责声明
这些信息和出版物并非旨在提供,也不构成TradingView提供或认可的任何形式的财务、投资、交易或其他类型的建议或推荐。请阅读使用条款了解更多信息。
免责声明
这些信息和出版物并非旨在提供,也不构成TradingView提供或认可的任何形式的财务、投资、交易或其他类型的建议或推荐。请阅读使用条款了解更多信息。