做空
$DWAC - Bearish Descending Triangle
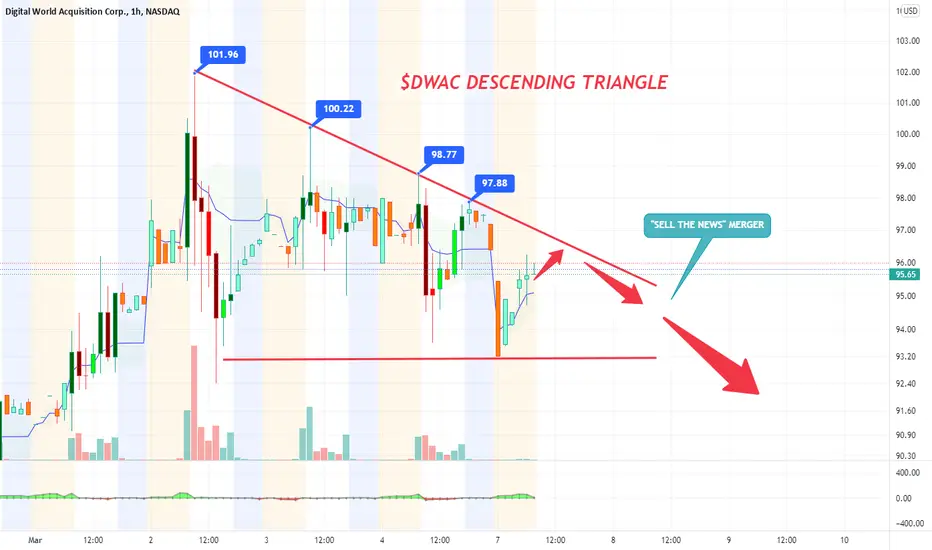
A descending triangle is a bearish chart pattern used in technical analysis that is created by drawing one trend line that connects a series of lower highs and a second horizontal trend line that connects a series of lows.
From Trading Sim:
You can identify the descending triangle reversal pattern at the top end of a rally. This pattern emerges as volume declines and the stock fails to make fresh highs. The pattern indicates that the bullish momentum is exhausting. At the same time, price action forms a horizontal support level.
After price bounces off the support level multiple times, posting lower highs, we can anticipate a potential downside breakout. The minimum distance that price moves prior to the breakout is measured from the initial high. This distance is projected lower after price breaks out below the support level.

免责声明
这些信息和出版物并非旨在提供,也不构成TradingView提供或认可的任何形式的财务、投资、交易或其他类型的建议或推荐。请阅读使用条款了解更多信息。