
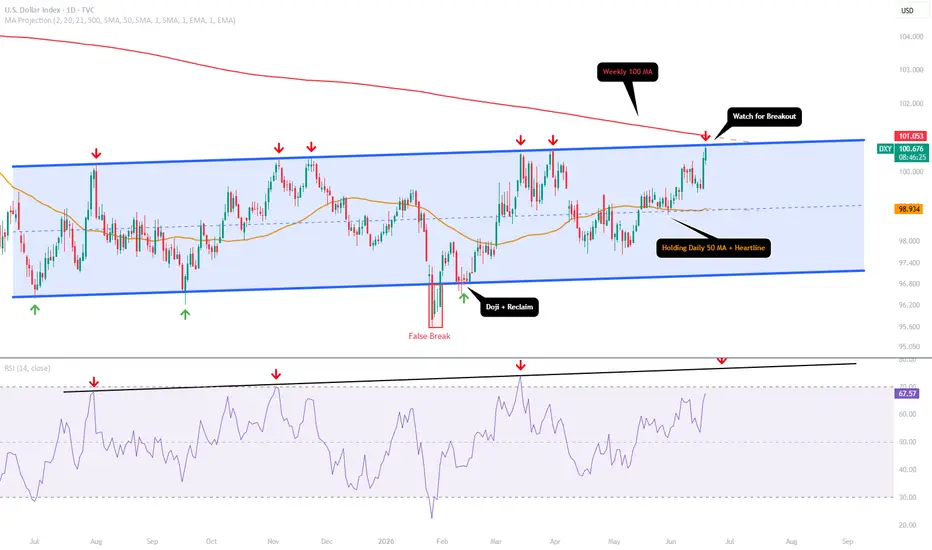
The target from my last post has just been achieved. The dollar found perfect support at the heartline of the channel and has made its move toward the upper range of the channel. For the full structural context view my previous idea here:
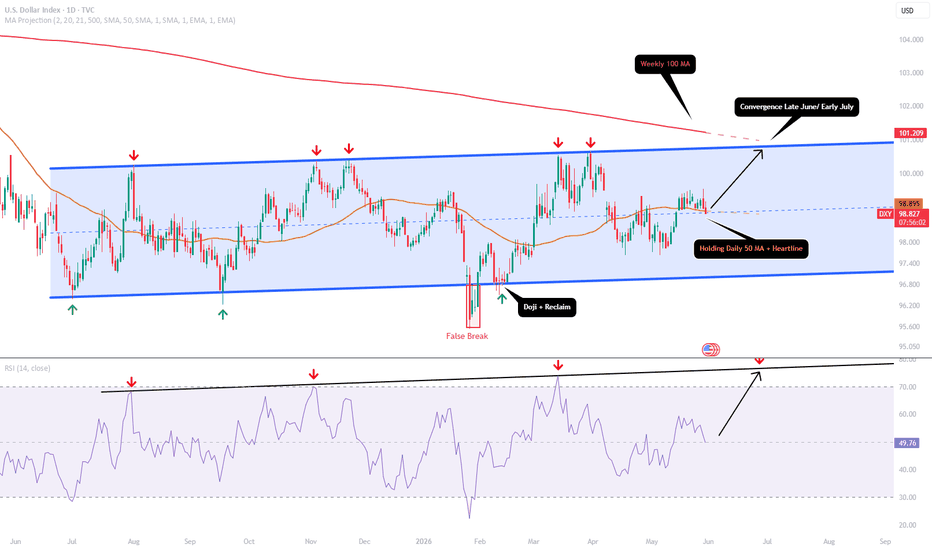
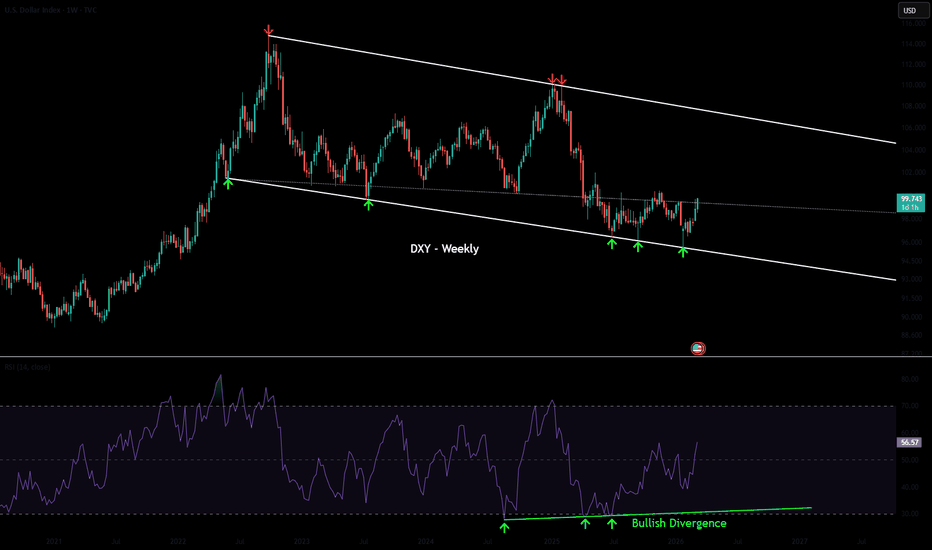
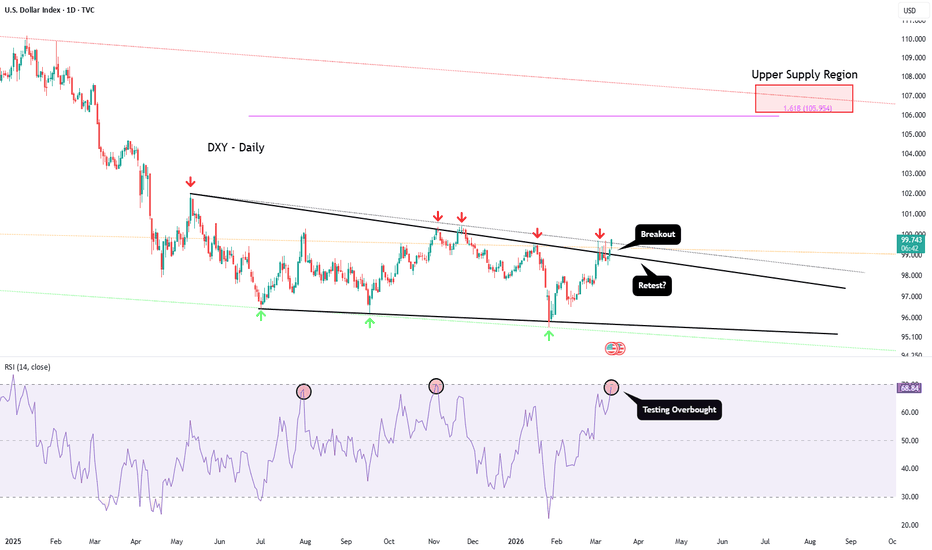
For the broader weekly and daily structural framework that has been in place since early in the year, view these ideas:
The timing of this move is particularly interesting. It has occurred almost precisely around Kevin Warsh's first meeting as Federal Reserve Chair, held on June 16 and 17, 2026. The market appears to be in the process of testing whether the new chair will do what the inflation data demands.
The Federal Reserve voted unanimously to hold its benchmark interest rate steady at the June meeting, with the dot plot signaling that the next move could actually be a rate increase rather than a cut.
The inflation backdrop is driving this shift. The Consumer Price Index has risen to an annual rate of 4.2% in May 2026, the highest since April 2023, driven primarily by the wartime spike in energy prices. The median PCE forecast from former Fed officials now sits at 3.5% for year-end, well above the Fed's 2% policy target.
However, this fed chair seems to have something his predecessor did not and that is the trust of the president. This gives him meaningful room to act independently on monetary policy without the political interference that characterized the Powell era. But, due to the circumstances, his first press conference made clear that he will not be delivering the immediate rate cuts Trump has publicly demanded. The market is now beginning to price in the possibility that the Fed's next move is a hike, not a cut. That is a fundamentally dollar-supportive environment and should lead to a stronger dollar and more pressure towards risk-on assets.
Examining the dollar's chart structure, the DXY appears to be preparing for a potential breakout. Price would first need to clear the weekly 100 MA (red MA), which currently sits around 101. Based on the RSI structure I have been tracking, here is the most probable path if the breakout confirms. Price breaks decisively above the top of the parallel channel, sending RSI momentum toward the black trendline where the red arrow is drawn. A cooloff period then follows, acting as the retest of the breakout, before the continuation move toward the extension targets I have outlined on the weekly timeframe.
However, since the parallel structure has not been broken yet, a retracement from current levels remains entirely possible. Without a solidified catalyst to break the dollar out of the existing structure, price could continue trading within this range until a clearer directional signal emerges.
Beyond the chart, the fundamental backdrop supports the bullish dollar thesis. Persistent inflation above 4%, a Fed that is now openly discussing rate hikes, elevated energy prices due to the ongoing Iran conflict, and a new Fed chair who has explicitly signaled a smaller balance sheet over time all point in the same direction.
Watch for a breakout of another breakdown from this parallel channel and the weekly 100 MA this week.
For the broader weekly and daily structural framework that has been in place since early in the year, view these ideas:
The timing of this move is particularly interesting. It has occurred almost precisely around Kevin Warsh's first meeting as Federal Reserve Chair, held on June 16 and 17, 2026. The market appears to be in the process of testing whether the new chair will do what the inflation data demands.
The Federal Reserve voted unanimously to hold its benchmark interest rate steady at the June meeting, with the dot plot signaling that the next move could actually be a rate increase rather than a cut.
The inflation backdrop is driving this shift. The Consumer Price Index has risen to an annual rate of 4.2% in May 2026, the highest since April 2023, driven primarily by the wartime spike in energy prices. The median PCE forecast from former Fed officials now sits at 3.5% for year-end, well above the Fed's 2% policy target.
However, this fed chair seems to have something his predecessor did not and that is the trust of the president. This gives him meaningful room to act independently on monetary policy without the political interference that characterized the Powell era. But, due to the circumstances, his first press conference made clear that he will not be delivering the immediate rate cuts Trump has publicly demanded. The market is now beginning to price in the possibility that the Fed's next move is a hike, not a cut. That is a fundamentally dollar-supportive environment and should lead to a stronger dollar and more pressure towards risk-on assets.
Examining the dollar's chart structure, the DXY appears to be preparing for a potential breakout. Price would first need to clear the weekly 100 MA (red MA), which currently sits around 101. Based on the RSI structure I have been tracking, here is the most probable path if the breakout confirms. Price breaks decisively above the top of the parallel channel, sending RSI momentum toward the black trendline where the red arrow is drawn. A cooloff period then follows, acting as the retest of the breakout, before the continuation move toward the extension targets I have outlined on the weekly timeframe.
However, since the parallel structure has not been broken yet, a retracement from current levels remains entirely possible. Without a solidified catalyst to break the dollar out of the existing structure, price could continue trading within this range until a clearer directional signal emerges.
Beyond the chart, the fundamental backdrop supports the bullish dollar thesis. Persistent inflation above 4%, a Fed that is now openly discussing rate hikes, elevated energy prices due to the ongoing Iran conflict, and a new Fed chair who has explicitly signaled a smaller balance sheet over time all point in the same direction.
Watch for a breakout of another breakdown from this parallel channel and the weekly 100 MA this week.

免责声明
这些信息和出版物并非旨在提供,也不构成TradingView提供或认可的任何形式的财务、投资、交易或其他类型的建议或推荐。请阅读使用条款了解更多信息。