
Currently at an area where price congested and broke higher to start a 23-month bull run in 2018-19.
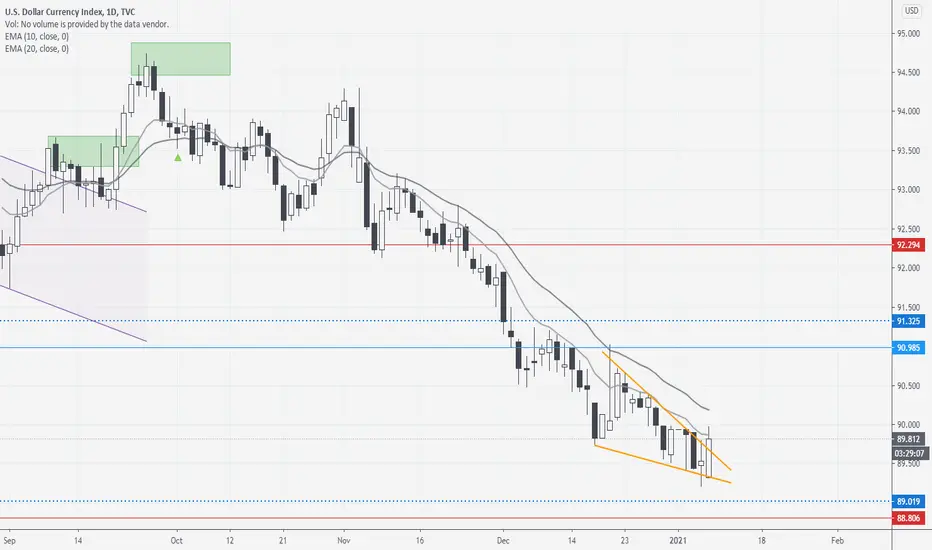
LTF is showing a possible bottom with the formation of a higher high and a breakout from this descending wedge pattern.
Likely to see some kind of trading range before any decisive bullish breakout/reversal but today's candle is pretty bullish and the bulls would be looking to close the day strong. Context is okay for reversal here so we shall see.
A bearish break below 89 invalidates this view.
Weekly chart:

LTF is showing a possible bottom with the formation of a higher high and a breakout from this descending wedge pattern.
Likely to see some kind of trading range before any decisive bullish breakout/reversal but today's candle is pretty bullish and the bulls would be looking to close the day strong. Context is okay for reversal here so we shall see.
A bearish break below 89 invalidates this view.
Weekly chart:

免责声明
这些信息和出版物并非旨在提供,也不构成TradingView提供或认可的任何形式的财务、投资、交易或其他类型的建议或推荐。请阅读使用条款了解更多信息。
免责声明
这些信息和出版物并非旨在提供,也不构成TradingView提供或认可的任何形式的财务、投资、交易或其他类型的建议或推荐。请阅读使用条款了解更多信息。