
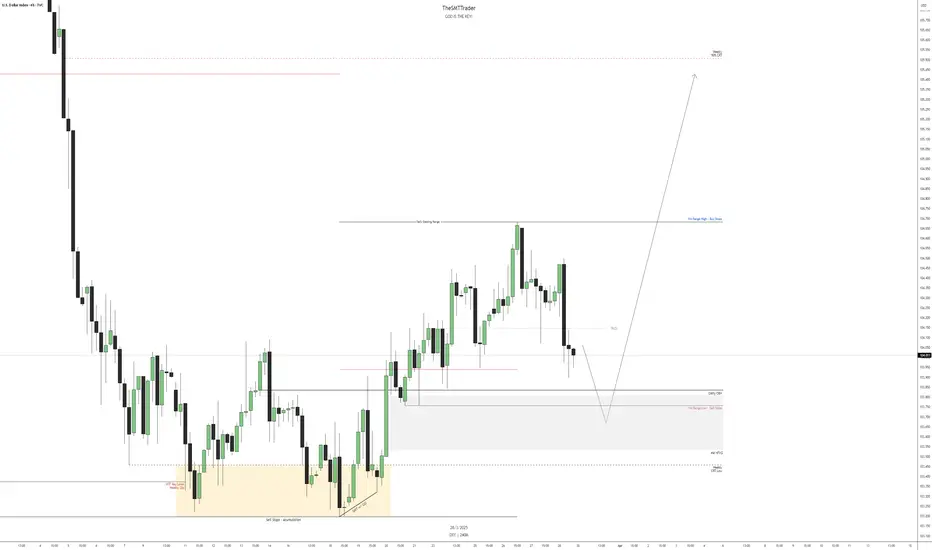
When analyzing the weekly DXY chart, we identify the presence of two CRTs: one bullish and one bearish. However, the bearish CRT has a low probability of success due to the candle formation and the fact that the price is still in a discounted region within the range.
Given this, our initial expectation is for the price to drop at the beginning of the week to seek liquidity in the equilibrium region of the daily range, which coincides with the 50% level of the bearish CRT. This movement may act as a correction within the predominant trend, pushing the price up toward the premium region of the weekly range. From that point, we will once again look for selling opportunities, as the market may resume its downward movement.
Based on this analysis, we initially seek selling opportunities down to the equilibrium region. Once this level is reached, we will wait for confirmation of a bullish reversal to look for buying opportunities up to the 50% mark of the bullish CRT.

免责声明
这些信息和出版物并非旨在提供,也不构成TradingView提供或认可的任何形式的财务、投资、交易或其他类型的建议或推荐。请阅读使用条款了解更多信息。