做空
DXY Comprehensive Analysis
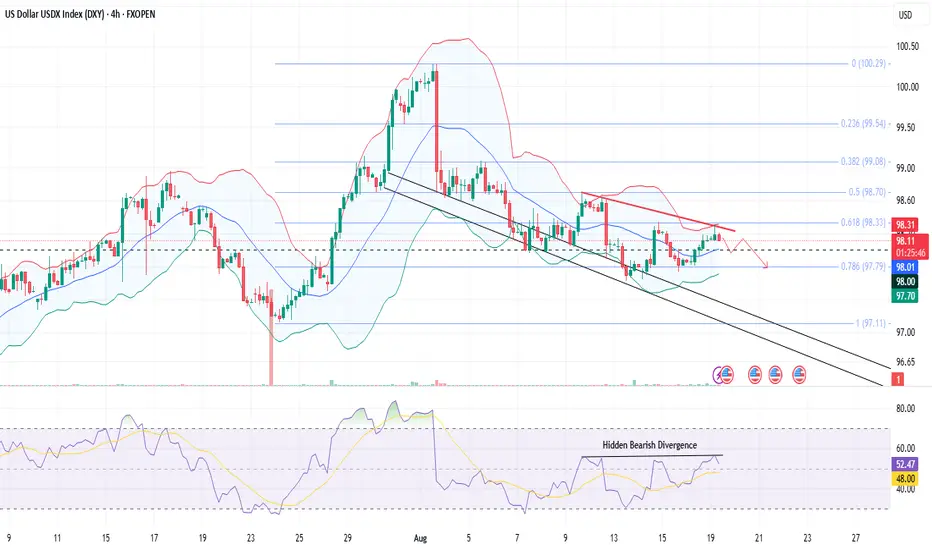
The US Dollar Index (DXY) is currently trading around 98.14, struggling near the 0.618 Fibonacci retracement at 98.33, where strong resistance has capped further upside.
The RSI shows hidden bearish divergence, signaling potential weakness despite the recent bounce.
Price action remains within a broader downtrend channel, and repeated failures to sustain above 98.30 indicate fading bullish momentum.
Immediate support is seen near 98.00, any bearish break out will lead the prices towards 97.79 (Fib 0.786), followed by 97.50, which could attract sellers if broken.
On the upside, only a decisive break above 98.33–98.70 would shift intraday sentiment bullish toward 99.08.
For today, the bias leans bearish as long as DXY trades below 98.30, with intraday traders likely eyeing short setups on rejection patterns targeting the lower supports.
The RSI shows hidden bearish divergence, signaling potential weakness despite the recent bounce.
Price action remains within a broader downtrend channel, and repeated failures to sustain above 98.30 indicate fading bullish momentum.
Immediate support is seen near 98.00, any bearish break out will lead the prices towards 97.79 (Fib 0.786), followed by 97.50, which could attract sellers if broken.
On the upside, only a decisive break above 98.33–98.70 would shift intraday sentiment bullish toward 99.08.
For today, the bias leans bearish as long as DXY trades below 98.30, with intraday traders likely eyeing short setups on rejection patterns targeting the lower supports.

免责声明
这些信息和出版物并非旨在提供,也不构成TradingView提供或认可的任何形式的财务、投资、交易或其他类型的建议或推荐。请阅读使用条款了解更多信息。
免责声明
这些信息和出版物并非旨在提供,也不构成TradingView提供或认可的任何形式的财务、投资、交易或其他类型的建议或推荐。请阅读使用条款了解更多信息。