
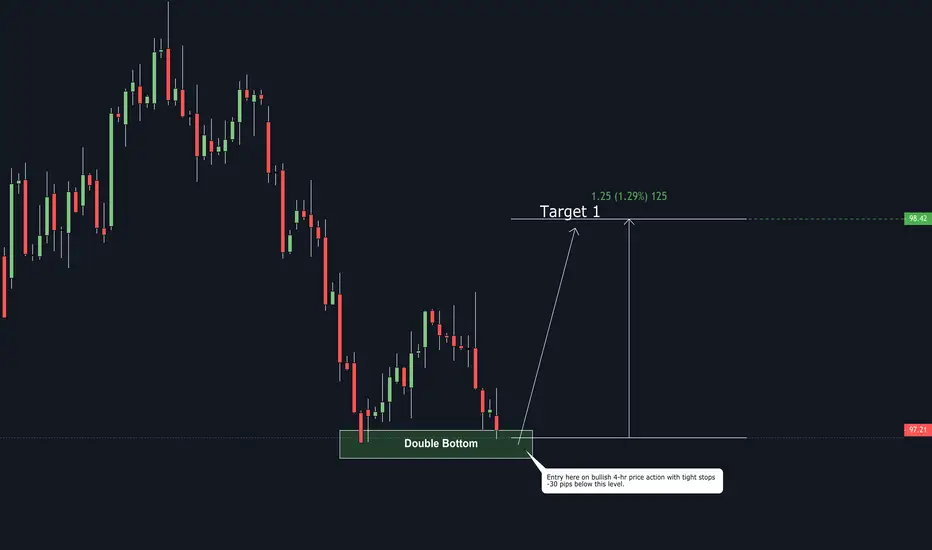
A double bottom is simply the opposite of a double top . This pattern normally occurs during a downtrend and is a signal of a reversal of the downtrend toward an uptrend. It’s easily recognizable by its resemblance to the letter “W”. The initial downward move will find a support at the first bottom and then the price action will rally off the support to a temporary new high
(the middle of the “W”). Another selloff will often take place that will reach the same support level of the first bottom, consequently sparking another upward rally. The trend is confirmed when the price breaks through the upper resistance to complete the pattern and reversal as displayed below. These are the most basic pattern structures of double tops and bottoms that you’re likely to come across. ( cont in our course)
Copyright 2020 © Alchemy FX All rights reserved.
No part of this book may be reproduced or used in any manner without written permission of the copyright owners except for the use of quotations in a book review.
(the middle of the “W”). Another selloff will often take place that will reach the same support level of the first bottom, consequently sparking another upward rally. The trend is confirmed when the price breaks through the upper resistance to complete the pattern and reversal as displayed below. These are the most basic pattern structures of double tops and bottoms that you’re likely to come across. ( cont in our course)
Copyright 2020 © Alchemy FX All rights reserved.
No part of this book may be reproduced or used in any manner without written permission of the copyright owners except for the use of quotations in a book review.

相关出版物
免责声明
这些信息和出版物并非旨在提供,也不构成TradingView提供或认可的任何形式的财务、投资、交易或其他类型的建议或推荐。请阅读使用条款了解更多信息。