
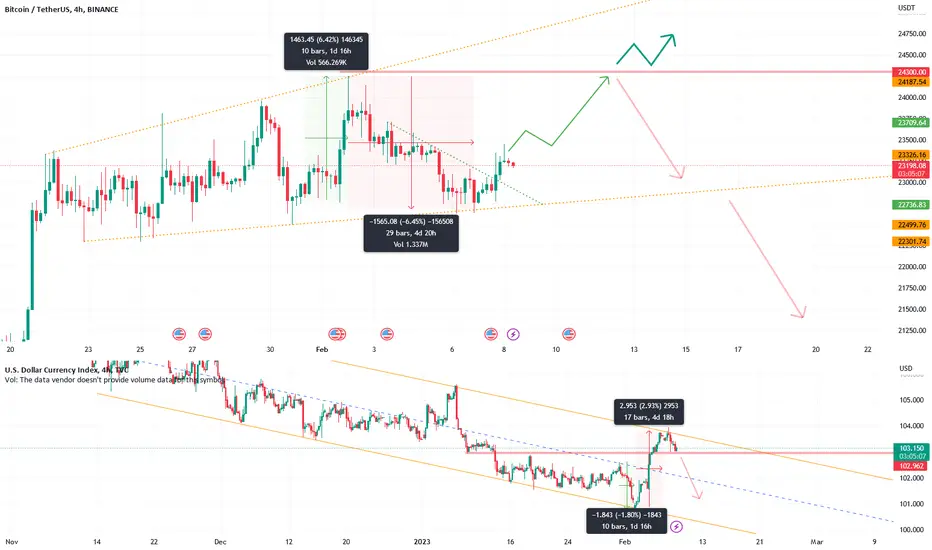
You can see that last two movements of bitcoin in the broadening ascending wedge is very similar to DXY movement's timing. Look at Green Boxes on both charts: DXY moved from midline to the bottom and bitcoin moved from bottom to top. Then look at Red Boxes: DXY moved from bottom to TOP, 2x previous price action but BTC came to the bottom line (ALMOST) the same much! I consider this as another good sign for BTC bulls.
Now, if DXY can break down 103 then BTC can go up to 24300$ with 22500$ as the stoploss.
Now, if DXY can break down 103 then BTC can go up to 24300$ with 22500$ as the stoploss.
订单已取消
DXY is not letting 103 go. We are not bullish for a while...
免责声明
这些信息和出版物并非旨在提供,也不构成TradingView提供或认可的任何形式的财务、投资、交易或其他类型的建议或推荐。请阅读使用条款了解更多信息。