
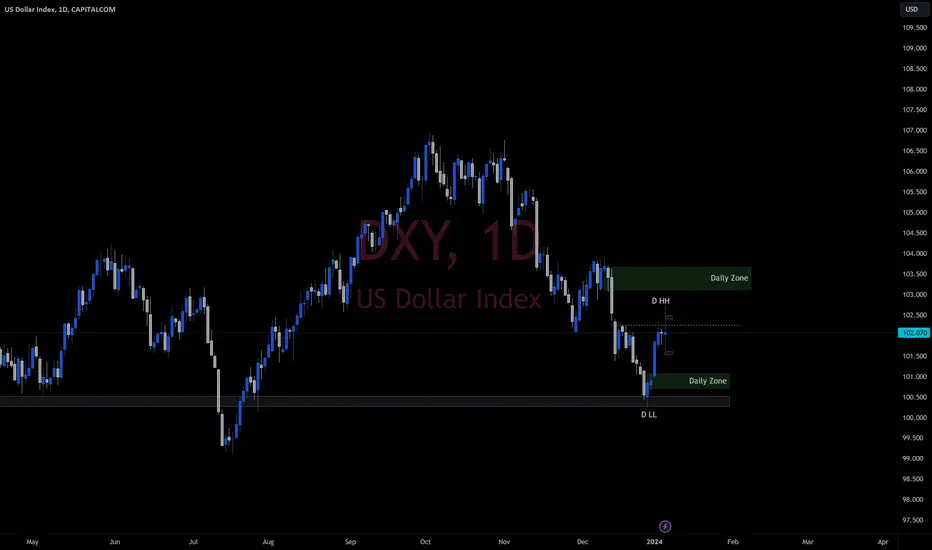
Technical analysis on DXY daily chart reveals several key points:
Positive Reaction at 100 Support Zone:
The price has shown a positive response at the strong support zone of 100, continuously rising throughout the past week.
Breaking the downtrend structure at 102.25 signals the strength of buying pressure.
Expected Correction and Continued Upside:
Anticipate a price correction towards the 101 level before resuming the upward journey towards 103.
However, it's crucial to note that on the daily timeframe, further observation is needed to confirm higher lows before making trading decisions.
Anticipated Week's Volatility:
Foresee potential oscillations and the formation of a sideways pattern (SW) at the beginning of the week.
Market volatility may intensify, especially with the release of CPI data on Thursday.
Monitoring Market Signals:
Watch the market's reaction post the CPI announcement for crucial insights into the next move for DXY.
Exercise caution and refrain from establishing specific trading plans solely based on the daily timeframe, emphasizing careful observation to confirm trends.

免责声明
这些信息和出版物并非旨在提供,也不构成TradingView提供或认可的任何形式的财务、投资、交易或其他类型的建议或推荐。请阅读使用条款了解更多信息。
免责声明
这些信息和出版物并非旨在提供,也不构成TradingView提供或认可的任何形式的财务、投资、交易或其他类型的建议或推荐。请阅读使用条款了解更多信息。