
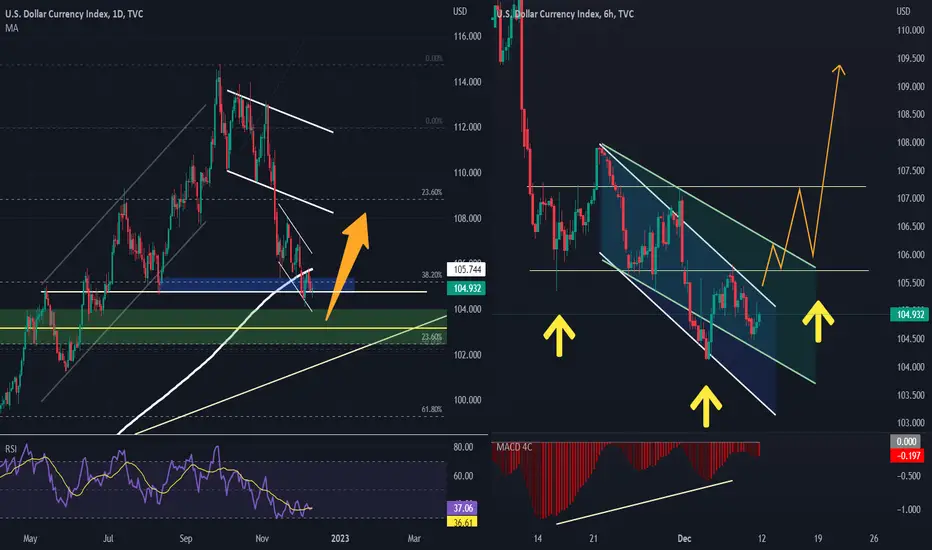
On the daily chart, The DXY holds in a powerful resistance zone; there is a 200DMA, monthly resistance, weekly resistance, and a supply zone with a 38.20 Fib.
In the 6-hour time frame, we have two reversal patterns, with a divergence in the MACD.
We may see a head and shoulders pattern if a candle closes above 105.74, as shown by the yellow arrows on the hourly chart.
--------------------------------
Feel free to share your thoughts in the comments, and kindly support the idea with a like. Your support is greatly appreciated!
In the 6-hour time frame, we have two reversal patterns, with a divergence in the MACD.
We may see a head and shoulders pattern if a candle closes above 105.74, as shown by the yellow arrows on the hourly chart.
--------------------------------
Feel free to share your thoughts in the comments, and kindly support the idea with a like. Your support is greatly appreciated!

免责声明
这些信息和出版物并非旨在提供,也不构成TradingView提供或认可的任何形式的财务、投资、交易或其他类型的建议或推荐。请阅读使用条款了解更多信息。