
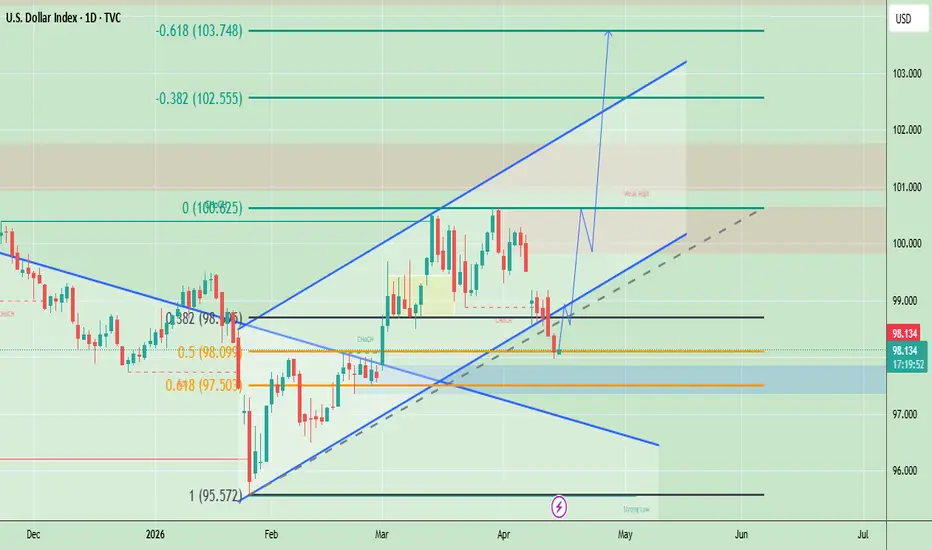
The US Dollar Index (DXY) is currently moving around the 98.10 support zone after a corrective pullback and technically its reacting near a strong confluence area 98.00-97.50 previous structure and an ascending trendline. Price has already shown a rejection wick from this zone suggesting buyers are stepping in.
The overall structure still remains bullish as long as the trendline and 97.50 low hold with the next upside targets aligning toward 100.50 (range resistance) followed by 102.50 and potentially 103.70.
From a fundamentals perspective the dollar is being supported by relatively stable US economic data sticky inflation expectations and cautious Federal Reserve outlook but upside momentum is slightly slow due to mixed signals on rate cuts and global risk sentiment.
Trade Plan – Buy Setup
Buy Zone: 97.50-8.10
Trigger: H1 bullish rejection (long wick) or strong bullish engulfing from support + trendline hold
Targets: 99.20 (gap fill), 100.50, 102.50
Invalidation: H1 close below 97.20
Note
Please risk management in trading is a Key so use your money accordingly. If you like the idea then please like and boost. Thank you and Good Luck!
The overall structure still remains bullish as long as the trendline and 97.50 low hold with the next upside targets aligning toward 100.50 (range resistance) followed by 102.50 and potentially 103.70.
From a fundamentals perspective the dollar is being supported by relatively stable US economic data sticky inflation expectations and cautious Federal Reserve outlook but upside momentum is slightly slow due to mixed signals on rate cuts and global risk sentiment.
Trade Plan – Buy Setup
Buy Zone: 97.50-8.10
Trigger: H1 bullish rejection (long wick) or strong bullish engulfing from support + trendline hold
Targets: 99.20 (gap fill), 100.50, 102.50
Invalidation: H1 close below 97.20
Note
Please risk management in trading is a Key so use your money accordingly. If you like the idea then please like and boost. Thank you and Good Luck!

免责声明
这些信息和出版物并非旨在提供,也不构成TradingView提供或认可的任何形式的财务、投资、交易或其他类型的建议或推荐。请阅读使用条款了解更多信息。