
Hello, members welcome to this DYDX/USDT 4hr chart analysis by CRYPTOSANDERS.
I have tried my best to bring the best possible outcome to this chart.
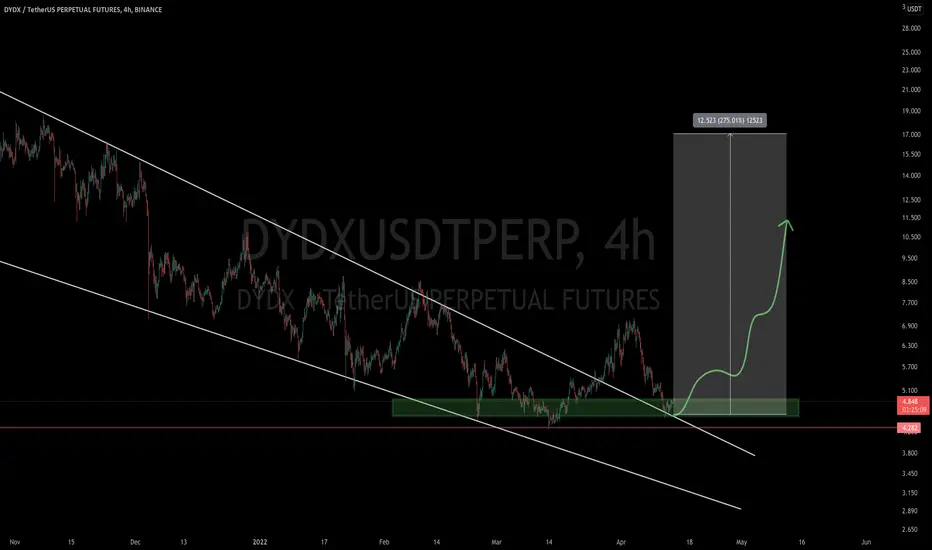
DYDX/USDT looks bullish here, As we can see in the above-mentioned chart that DYDX broke the falling wedge pattern and retested.
In the current scenario, it's still trading at the green zone which is also the buy zone.
I am expecting a 275% potential rally in the upcoming weeks.
So we can hold it at the spot for upcoming 2 to 3 months for some good profit.
Entry:- $4.50,$4.90
Traget:- 275%
Stoploss:- $4.30
Remember:-This is not a piece of financial advice. All investment made by me is at my own risk and I am held responsible for my own profit and losses. So, do your own research before investing in this trade.
Happy trading.
Sorry for my English it is not my native language.
Do hit the like button if you like it and share your charts in the comments section.
Thank you...
I have tried my best to bring the best possible outcome to this chart.
DYDX/USDT looks bullish here, As we can see in the above-mentioned chart that DYDX broke the falling wedge pattern and retested.
In the current scenario, it's still trading at the green zone which is also the buy zone.
I am expecting a 275% potential rally in the upcoming weeks.
So we can hold it at the spot for upcoming 2 to 3 months for some good profit.
Entry:- $4.50,$4.90
Traget:- 275%
Stoploss:- $4.30
Remember:-This is not a piece of financial advice. All investment made by me is at my own risk and I am held responsible for my own profit and losses. So, do your own research before investing in this trade.
Happy trading.
Sorry for my English it is not my native language.
Do hit the like button if you like it and share your charts in the comments section.
Thank you...

相关出版物
免责声明
这些信息和出版物并非旨在提供,也不构成TradingView提供或认可的任何形式的财务、投资、交易或其他类型的建议或推荐。请阅读使用条款了解更多信息。