
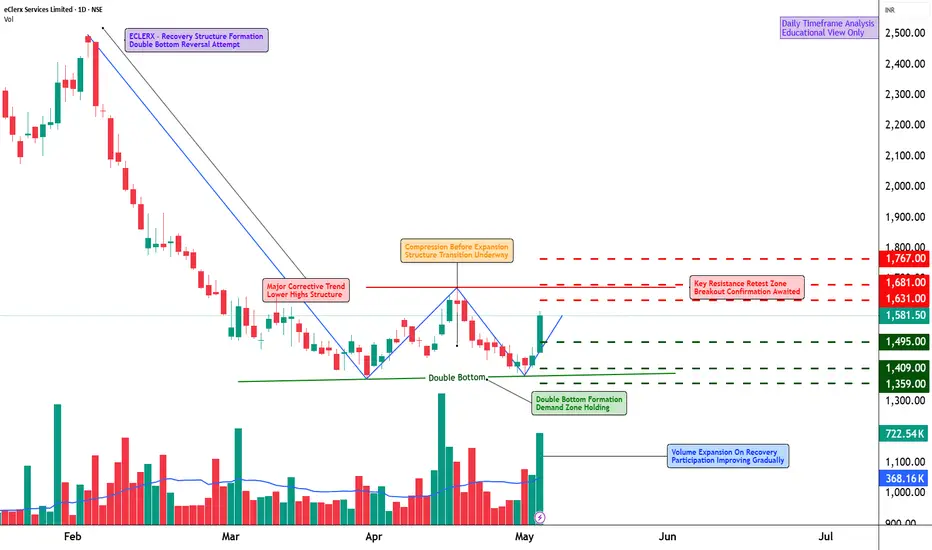
📊 ECLERX – Technical & Educational Snapshot
Ticker: NSE: ECLERX
Sector: 💻 IT / Digital Operations & Analytics
CMP: 1,581.50 ▲ (+9.16% | 06 May 2026)
Learning Rating: ⭐⭐⭐⭐☆ (Recovery Continuation Structure)
Chart Pattern Observed: 📊 Base Formation → Recovery Bounce → Consolidation
Candlestick Pattern Observed: Three Outside Up Pattern | Double Bottom Pattern
📊 Technical Snapshot
ECLERX is showing signs of recovery after a prolonged corrective phase, with price attempting to stabilise above recent demand zones. The latest bullish structure reflects improving participation after consolidation near support regions. RSI is placed near 56.6, indicating balanced momentum with room for further expansion if price sustains above nearby resistance levels. MACD is gradually improving, suggesting strengthening momentum after a period of weakness. Bollinger Bands are moderately compressed, signalling the possibility of volatility expansion if breakout confirmation appears. Price is currently trading near an important reaction area, and sustained acceptance above nearby resistance clusters may support continuation toward higher Fibonacci extension zones.
📊 Volume Analysis
🔹 Current Volume: ~722.54K
🔹 Average Volume (20-period): ~368.15K ✅
💥 Volume is running at nearly 2× the recent average, confirming improving participation during the recovery phase.
💡 Interpretation: Higher-than-average participation near support and breakout zones often reflects renewed buying interest and short-covering activity. Continued volume support remains important for sustaining the recovery structure.
🔑 Key Levels – Daily Timeframe
Support Areas: 1495 | 1450 | 1375
Resistance Areas: 1631 | 1681 | 1767
These are zones where price has paused or reacted earlier.
📉 Pullback Zones (Chart-Based Observation)
Healthy Pullback Zone 1: 1495 - 1486
Healthy Pullback Zone 2: 1444 – 1409
Deep Pullback Support Zone: 1375 - 1359
💡 Pullbacks holding above these zones may support continuation recovery, while deeper weakness can weaken the developing bullish structure.
What’s Catching Our Eye: Recovery structure improving with stronger bullish participation.
What to Watch For: Acceptance above the 1631 resistance zone.
Failure Zone: Sustained weakness below 1495 weakens recovery momentum.
Risks to Watch: Resistance pressure from prior supply zones.
What to Expect Next: Consolidation followed by possible directional expansion.
Bullish Case: Sustained buying above resistance may trigger continuation momentum.
Bearish Case: Rejection near resistance may lead to range-bound behaviour.
Momentum Case: Momentum improving gradually with healthy structure formation.
STWP Equity Snapshot – ECLERX
Intraday Setup:
Reference: 1,594.9
Invalidation level: 1,526
Upside Reference 1: 1,664
Upside Reference 2: 1,733
Swing Setup (Hybrid Model – 2–5 days):
Reference: 1,594.9
Invalidation level: 1,381.35
Upside Reference 1: 1,808.45
Upside Reference 2: 2,021.95
STWP View:
• Sentiment: Bullish | Trend: Recovery Uptrend
• RSI: 56.66 (Healthy Momentum Zone)
• Volume: Strong Participation
• Structure: Recovery Continuation Setup
• AI Score: 98/100 | Strength: 5.0/5
Final Outlook
Momentum: Strong
Trend: Up
Risk: High
Volume: High
Learning Note: Strong recoveries often begin with stabilisation, not immediate vertical rallies.
Disclaimer:
This analysis is generated strictly for educational and analytical purposes only.
This does NOT constitute investment advice, trading advice, or a recommendation to buy or sell any security or derivative instrument.
Readers are advised to exercise independent judgment and consult a SEBI-registered financial advisor before taking any trading or investment decisions.
STWP assumes no responsibility for any financial loss arising from the use of this analysis.
💬 Recovery setup or temporary bounce — what does the structure suggest to you?
🔼 Boost | ✍️ Comment | 🔁 Share with a learner
👉 Follow STWP for clean chart-reading insights
🚀 Stay Calm. Stay Clean. Trade With Patience.

STWP | Mentor & Demand-Supply Specialist |
Empowering traders through structured learning |
simpletradewithpatience.com
chat.whatsapp.com/CpgyHCfioQ5Hxf7rd8pDqw
wa.me/message/6IOPHGOXMGZ4N1
Educational Only
Empowering traders through structured learning |
simpletradewithpatience.com
chat.whatsapp.com/CpgyHCfioQ5Hxf7rd8pDqw
wa.me/message/6IOPHGOXMGZ4N1
Educational Only
免责声明
这些信息和出版物并非旨在提供,也不构成TradingView提供或认可的任何形式的财务、投资、交易或其他类型的建议或推荐。请阅读使用条款了解更多信息。