
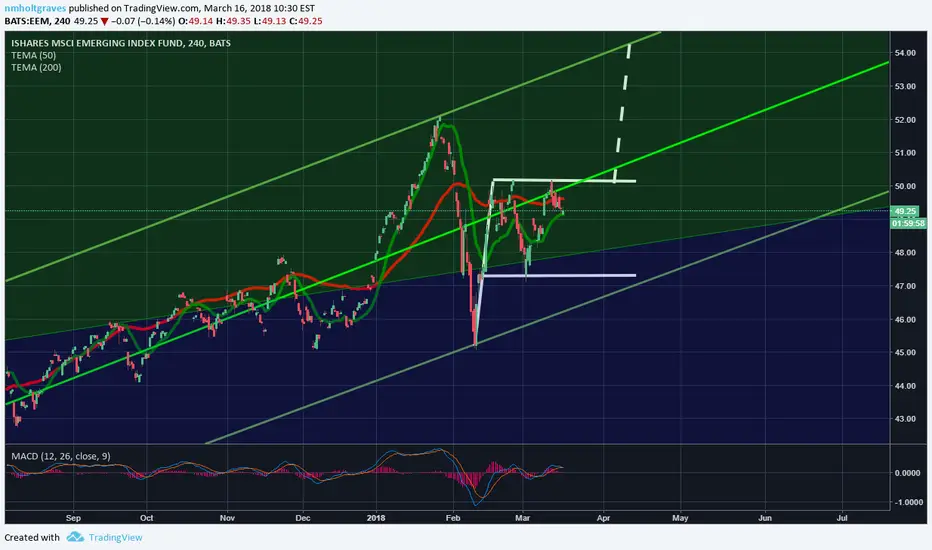
Good Evening! This is a brief analysis for EEM -0.31% using a 4 hour chart! Keeping it simple, we're sitting nicely in the middle of our traditional long term support and resistance. The light-green trend-line verifies that. I used an Andrew's pitchfork created with the high of 2011 and low of 2016. It's a nice long term trend analysis. We're retesting the middle support of the pitchfork a lot recently, and with how much we breakout, it's proving to not be as useful an indicator right now. still, we're sitting mostly in the pitchfork's middle S&R in 2018, so I'm optimistic we'll have a lot more harder tests of the support line. The 200 EMA has been above the 50 EMA for over a month now, but they're getting closer and could help signal that breakout. We have positive volume for the most part and the MACD is still upwardly transected, though it's path is a little flatter now. It's been a little shaky coming off our high in mid-January, but the bulls are back at it and hey they even made a flag. :) We'll be in this flag for a little while, I'll give it 20 days at the verrrrry most for us to hit breakout at $50. We'll hit $52 within 2 months and probably retest that level a few times before breaking out and hitting $53 by mid-May. It will be bloody and we're certain to retest $50 a lot before breaking out.
This has been an educational only analysis by nmholtgraves!
This has been an educational only analysis by nmholtgraves!

免责声明
这些信息和出版物并非旨在提供,也不构成TradingView提供或认可的任何形式的财务、投资、交易或其他类型的建议或推荐。请阅读使用条款了解更多信息。
免责声明
这些信息和出版物并非旨在提供,也不构成TradingView提供或认可的任何形式的财务、投资、交易或其他类型的建议或推荐。请阅读使用条款了解更多信息。