
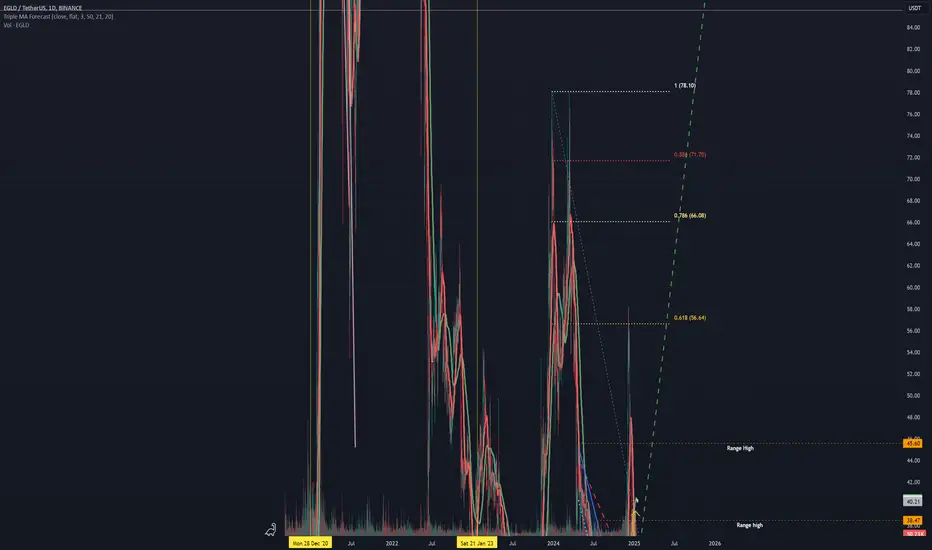
The price of EGLD has successfully broken out of its downward parallel channel, which lasted from April to November 2024. After reaching a high of around $55, the price retraced, giving back some of its earlier gains, but is now holding above the $30 support level.

Although the price faced significant selling pressure, it has remained above the previous range and the downward trendline (now acting as support).
From January 3 to January 6, the price attempted to break above the range but fell back to the lows of the range. Since then, a diamond pattern has emerged on the 1H and 4H timeframes, signaling a potential bullish reversal. If the price holds above $32, the diamond pattern remains valid, and a move to the upside is anticipated. This could lead to a retest of the range’s upper range around $40. A successful breakout may push the price towards higher resistance levels at $45–$55 and $75–$78.

Although the price faced significant selling pressure, it has remained above the previous range and the downward trendline (now acting as support).
From January 3 to January 6, the price attempted to break above the range but fell back to the lows of the range. Since then, a diamond pattern has emerged on the 1H and 4H timeframes, signaling a potential bullish reversal. If the price holds above $32, the diamond pattern remains valid, and a move to the upside is anticipated. This could lead to a retest of the range’s upper range around $40. A successful breakout may push the price towards higher resistance levels at $45–$55 and $75–$78.

免责声明
这些信息和出版物并非旨在提供,也不构成TradingView提供或认可的任何形式的财务、投资、交易或其他类型的建议或推荐。请阅读使用条款了解更多信息。