
Hello Crypto Lovers,
Mars Signals team wishes you high profits.
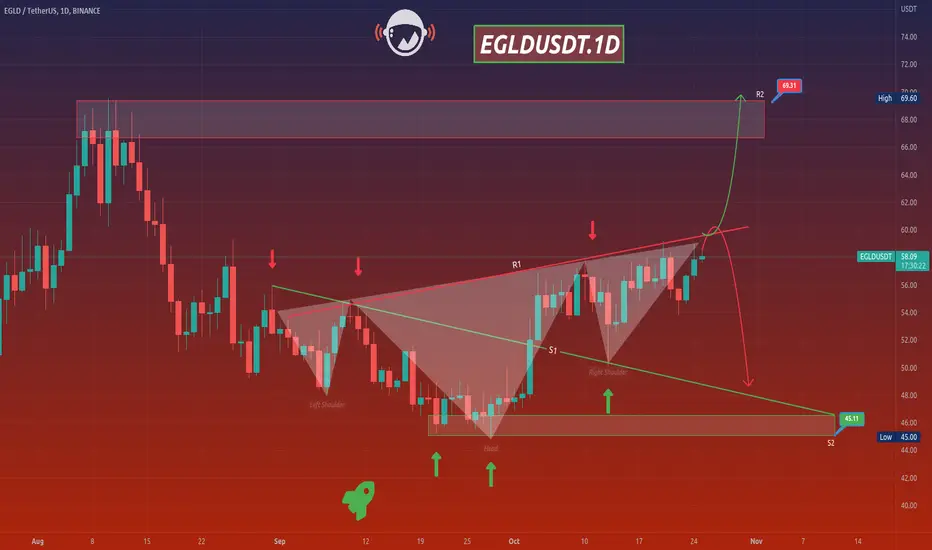
This is a one-day-time frame analysis for EGLDUSDT
Currently, we have R2 and R1 as our resistance areas which both include the disability of the price in order to rise. S1 used to be a resistance line and S2 is our support area with its support of price at different points. Therefore, we have the fluctuation of price below R1 and we predict two options here. If we receive some confirmation candles to rise, there will be an increase for the price up to R2. But in case the price gives us some falling signs, we will have a decline for it toward S1 or even S2. The point is to activate your stop-loss points in order to have less risky trades.
Warning: This is just a suggestion and we do not guarantee profits. We advise you to analyze the chart before opening any positions.
Wish you luck

免责声明
这些信息和出版物并非旨在提供,也不构成TradingView提供或认可的任何形式的财务、投资、交易或其他类型的建议或推荐。请阅读使用条款了解更多信息。
免责声明
这些信息和出版物并非旨在提供,也不构成TradingView提供或认可的任何形式的财务、投资、交易或其他类型的建议或推荐。请阅读使用条款了解更多信息。