做空
ARSHAM- EOSUSDT DAILY CHART
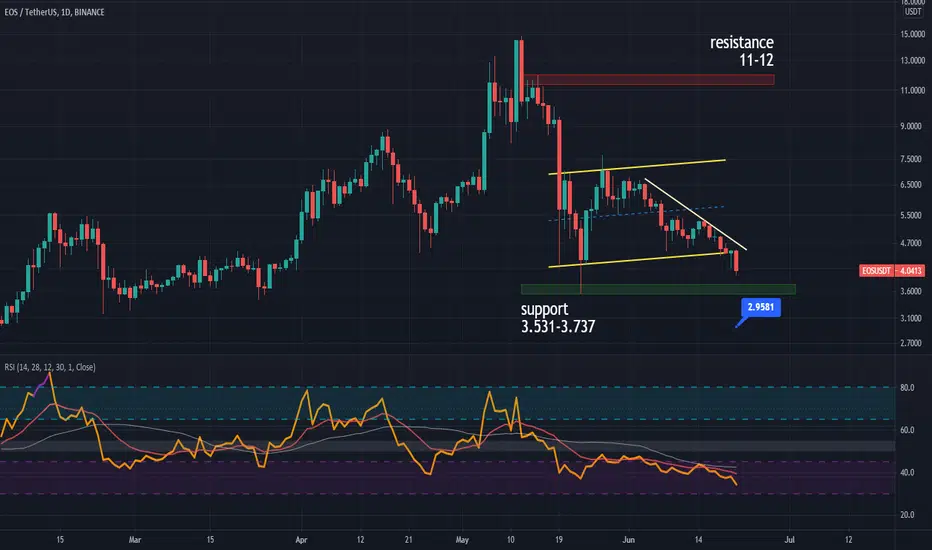
EOS was on a channel but it reached the end of the channel and was not supported there and now it has been able to break the bottom of the channel as well.
and we have support area at 3.531$.
if it is supported there it will try to break the resistance of the channel floor again and enter the channel again but if EOS is not supported t will see 2.95$ and also in the chart when we used RSI we did not see any divergence in it
please share youre idea in comment
and follow me
dont forget like
and we have support area at 3.531$.
if it is supported there it will try to break the resistance of the channel floor again and enter the channel again but if EOS is not supported t will see 2.95$ and also in the chart when we used RSI we did not see any divergence in it
please share youre idea in comment
and follow me
dont forget like

免责声明
这些信息和出版物并非旨在提供,也不构成TradingView提供或认可的任何形式的财务、投资、交易或其他类型的建议或推荐。请阅读使用条款了解更多信息。
免责声明
这些信息和出版物并非旨在提供,也不构成TradingView提供或认可的任何形式的财务、投资、交易或其他类型的建议或推荐。请阅读使用条款了解更多信息。