做多
EOSUSDT
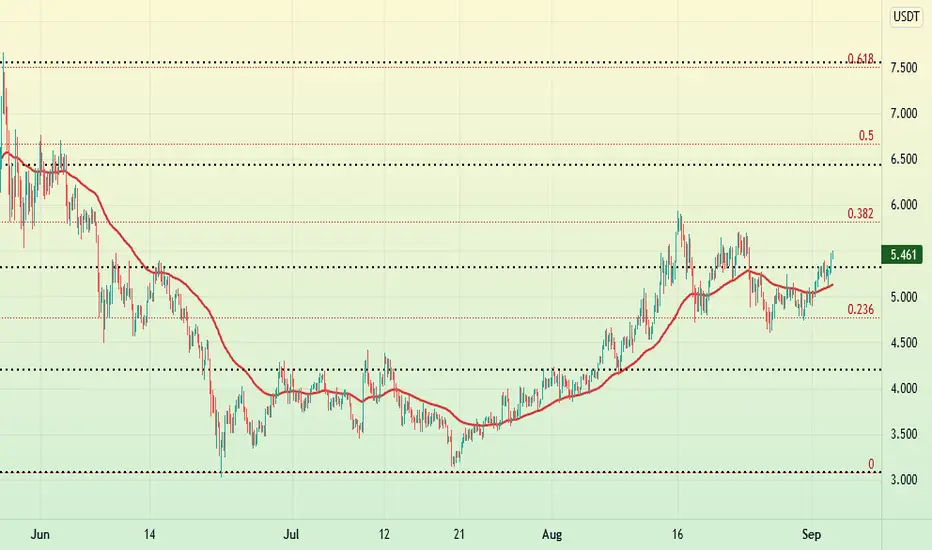
Look at black dotted lines on my chart...
They are support & resistance for moving average thats mean when MA cross above or below this lines,Price starting to Reaction
For example On EOS 4H chart when MA cross above 5.31 line, price will go to the next resistance on 6.4 & 7.5
Crossing MA on upper time frame like Daily, Weekly , ... will be bigger but i prefer to work on 4H time frame

免责声明
这些信息和出版物并非旨在提供,也不构成TradingView提供或认可的任何形式的财务、投资、交易或其他类型的建议或推荐。请阅读使用条款了解更多信息。
免责声明
这些信息和出版物并非旨在提供,也不构成TradingView提供或认可的任何形式的财务、投资、交易或其他类型的建议或推荐。请阅读使用条款了解更多信息。