
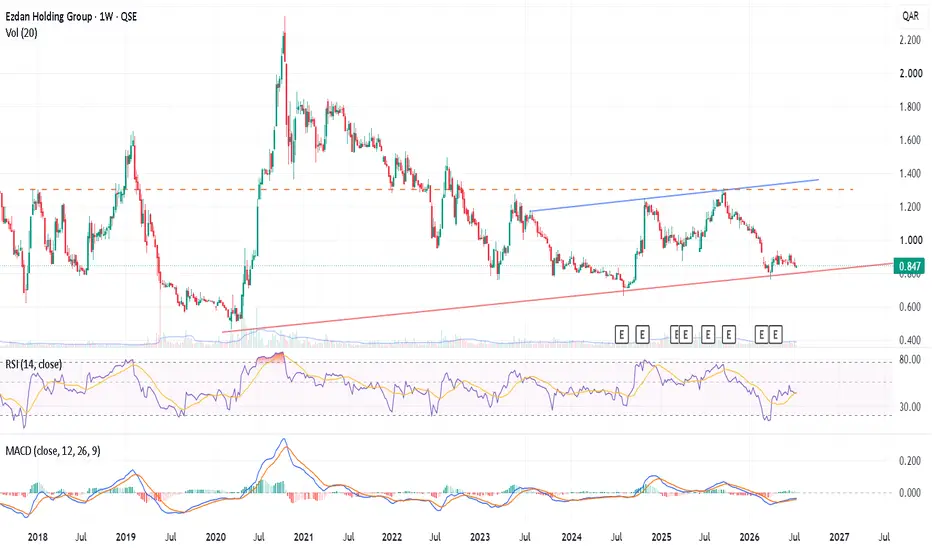
ERES (1W): Testing Key Macro Trendline Support – Accumulation Zone or Breakdown Risk?
Market Overview
Technical Analysis
1. Major Multi-Year Ascending Trendline
On the weekly frame, Ezdan Holding Group is trading right against a critical, long-term ascending support trendline (marked by the solid red line) extending back from the major 2020 macro bottom. Price action has recently experienced a cooling-off period from its late-2025 swing high and is now consolidating tightly just above this primary dynamic floor (0.800 - 0.830 QAR).
2. Overhead Structural Resistance
The Dynamic Ceiling: A secondary, gently ascending blue resistance line tracks the peaks from mid-2023 and late-2025, currently capping the upside around the 1.300 QAR area.
The Macro Pivot Baseline: A long-term horizontal dashed orange line cuts right through the multi-year chart at approximately 1.330 QAR, marking a major historical inflection zone.
3. Technical Indicators
Volume: Volume has stabilized significantly during this consolidation phase, indicating that selling pressure is beginning to dry up as price meets major trendline support.
RSI (14): Currently flattening out at 39.61, sitting right beside its yellow signal line (39.43). The indicator is stabilizing just above oversold territory, reflecting a neutral momentum regime that often precedes an accumulation bounce.
MACD (12, 26, 9): Both the MACD line ( -0.039) and the Signal line (-0.045) remain below the zero mark following the recent correction. However, the lines are beginning to flatten out and converge, while the bearish histogram is rapidly diminishing toward zero. A bullish crossover here would confirm the structural bottom.
Trading Setup & Scenario Planning
The Accumulation Long Setup (Trendline Bounce)
_________________________
This multi-year trendline has protected the downside for over six years. Will the buyers step up once again to trigger a major recovery rally, or is the macro structure under threat? Let me know your setup in the comments!
Market Overview
- Ticker: Ezdan Holding Group (ERES / QSE)
- Timeframe: 1-Week (1W)
- Current Price: 0.847 QAR
- Sentiment: Neutral / Accumulation at Key Structural Support
Technical Analysis
1. Major Multi-Year Ascending Trendline
On the weekly frame, Ezdan Holding Group is trading right against a critical, long-term ascending support trendline (marked by the solid red line) extending back from the major 2020 macro bottom. Price action has recently experienced a cooling-off period from its late-2025 swing high and is now consolidating tightly just above this primary dynamic floor (0.800 - 0.830 QAR).
2. Overhead Structural Resistance
The Dynamic Ceiling: A secondary, gently ascending blue resistance line tracks the peaks from mid-2023 and late-2025, currently capping the upside around the 1.300 QAR area.
The Macro Pivot Baseline: A long-term horizontal dashed orange line cuts right through the multi-year chart at approximately 1.330 QAR, marking a major historical inflection zone.
3. Technical Indicators
Volume: Volume has stabilized significantly during this consolidation phase, indicating that selling pressure is beginning to dry up as price meets major trendline support.
RSI (14): Currently flattening out at 39.61, sitting right beside its yellow signal line (39.43). The indicator is stabilizing just above oversold territory, reflecting a neutral momentum regime that often precedes an accumulation bounce.
MACD (12, 26, 9): Both the MACD line ( -0.039) and the Signal line (-0.045) remain below the zero mark following the recent correction. However, the lines are beginning to flatten out and converge, while the bearish histogram is rapidly diminishing toward zero. A bullish crossover here would confirm the structural bottom.
Trading Setup & Scenario Planning
The Accumulation Long Setup (Trendline Bounce)
- Entry Zone: 0.830 – 0.850 QAR (Excellent risk-to-reward ratio given the proximity to a multi-year macro floor).
- Target 1 (Mid-Term): 1.050 QAR (Psychological round number and recent minor consolidation peak).
- Target 2 (Long-Term): 1.250 – 1.300 QAR (Retest of the long-term blue ascending trendline and structural horizontal resistance).
- Stop Loss: A definitive weekly candle close below 0.790 QAR invalidates this macro bullish defense thesis.
_________________________
This multi-year trendline has protected the downside for over six years. Will the buyers step up once again to trigger a major recovery rally, or is the macro structure under threat? Let me know your setup in the comments!

免责声明
这些信息和出版物并非旨在提供,也不构成TradingView提供或认可的任何形式的财务、投资、交易或其他类型的建议或推荐。请阅读使用条款了解更多信息。