
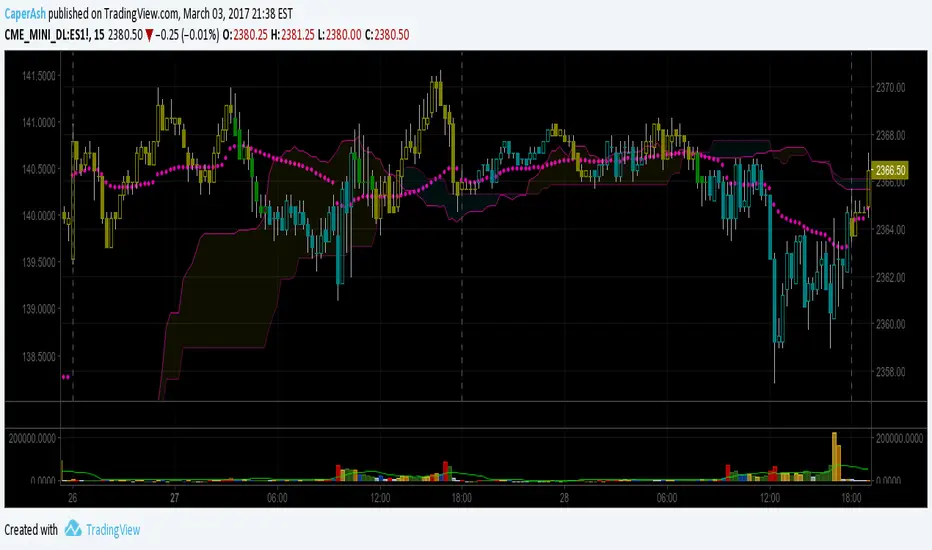
I very much like the Ichimoku approach but don't like all the lines on the chart so usually only use the Clouds. Here is one way to keep track of one aspect of the Ichi method without the chart clutter, namely these paint bars calculated as follows:
The 9 bar donchian > 26 bar donchian = up color;
The 9 bar donchian < 26 bar donchian = down color;
The 9 bar donchian == 26 bar donchian = neutral color.
I have included notes about how to put it on a chart in the code; basically I recommend using hollow candles without borders.
On the attached chart I have the Ichimoku Clouds along with the vwap. I find this makes a very clean chart with quite a bit of information, especially when the messages conflict or converge.
To tell the truth, I still prefer to just work with the clouds for support / resistance guidelines, but these paintbars are a nifty way of including more information without cluttering up the chart. Enjoy.
PS I just realised I published this as an idea instead of as a script. Will go do that now.

免责声明
这些信息和出版物并非旨在提供,也不构成TradingView提供或认可的任何形式的财务、投资、交易或其他类型的建议或推荐。请阅读使用条款了解更多信息。