
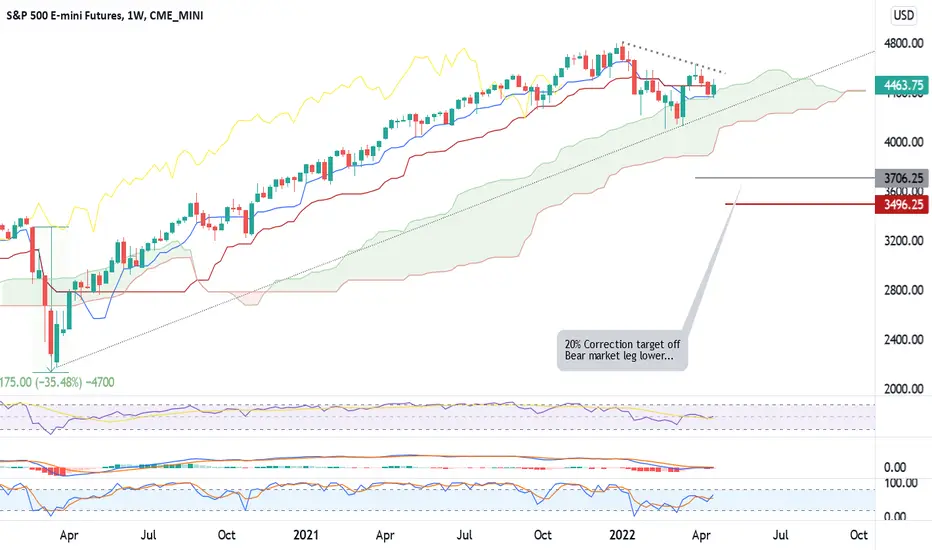
E-mini S&P 500 (futures) – Weekly: Momentum Indicators (Stochastic, MACD, RSI) Trying to maintain upward momentum, but mostly neutral.
Ichimoku (at a glance) Indicator(s) Blue Tenkan line and Cloud support at 4366 held last week and so far this week. Yellow Lagging (26wk) indicator is attracted to previous price action and has been retracing previous prices the past 7 weeks. The bounce off the cloud is trying to rally bulls above the red Kijun resistance at 4455 and then to the downtrend line in the 4600 area. A break below into the cloud has support at 4100.
Support seems strong but a move below 4100 opens the door for a change in trend lower. 1. Tenkan crosses below Kijun 2. Lagging indicator below previous price action. 3. A break below the cloud 4. Cloud twist from green to red
Ichimoku (at a glance) Indicator(s) Blue Tenkan line and Cloud support at 4366 held last week and so far this week. Yellow Lagging (26wk) indicator is attracted to previous price action and has been retracing previous prices the past 7 weeks. The bounce off the cloud is trying to rally bulls above the red Kijun resistance at 4455 and then to the downtrend line in the 4600 area. A break below into the cloud has support at 4100.
Support seems strong but a move below 4100 opens the door for a change in trend lower. 1. Tenkan crosses below Kijun 2. Lagging indicator below previous price action. 3. A break below the cloud 4. Cloud twist from green to red

免责声明
这些信息和出版物并非旨在提供,也不构成TradingView提供或认可的任何形式的财务、投资、交易或其他类型的建议或推荐。请阅读使用条款了解更多信息。