
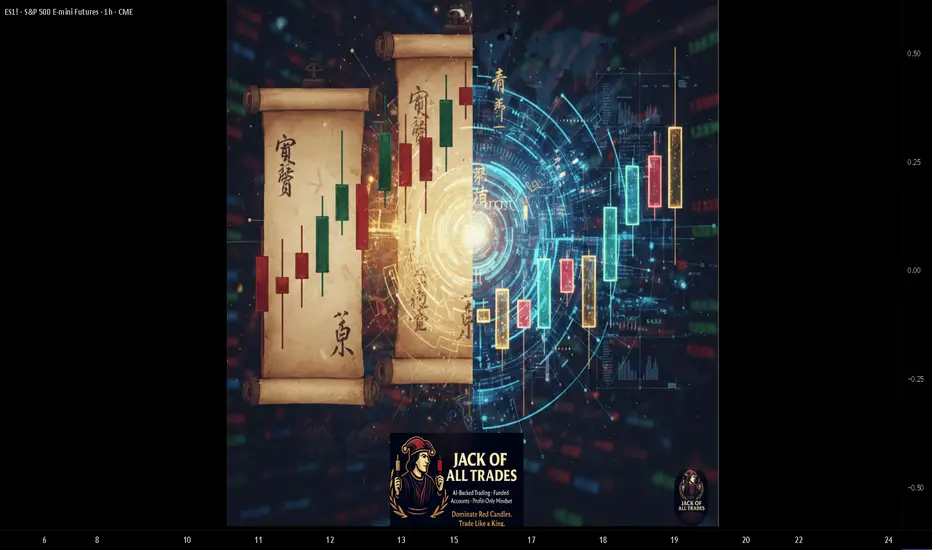
Candlesticks Have Been Reading Market Psychology for 300 Years. Here's Why They Still Work.
In the 1700s, Japanese rice traders developed a visual language to read market emotion.
Three centuries later, with AI, algorithms, and high-frequency trading, those same patterns still work.
Why? Because candlesticks don't predict the future — they reveal human psychology. And that hasn't changed.
What Candlesticks Really Tell You
Each candlestick is a story:
The Body:
- Open to close
- Shows who won the battle (bulls or bears)
- Size shows conviction
The Wicks (Shadows):
- High and low of the period
- Shows rejection
- Long wicks = failed attempts
The Color:
- Green/White = Bulls won (close > open)
- Red/Black = Bears won (close < open)
Single Candlestick Patterns
1. Doji
Appearance:
Open and close nearly equal. Small or no body.
Psychology:
Indecision. Bulls and bears fought to a draw.
Trading Implication:
- In uptrend: Potential reversal
- In downtrend: Potential reversal
- In range: Continuation of indecision
Confirmation Needed:
Doji alone isn't enough. Wait for next candle.
2. Hammer
Appearance:
Small body at top, long lower wick (2-3x body size), little to no upper wick.
Psychology:
Bears pushed price down, bulls rejected and pushed back up.
Trading Implication:
- Appears at bottom of downtrend
- Bullish reversal signal
- Stronger if green
3. Shooting Star
Appearance:
Small body at bottom, long upper wick, little to no lower wick.
Psychology:
Bulls pushed price up, bears rejected and pushed back down.
Trading Implication:
- Appears at top of uptrend
- Bearish reversal signal
- Stronger if red
4. Marubozu
Appearance:
Large body, no wicks (or very small).
Psychology:
Complete domination by one side. No rejection.
Trading Implication:
- Bullish Marubozu: Strong continuation up
- Bearish Marubozu: Strong continuation down
- Shows conviction
Two-Candlestick Patterns
1. Engulfing Pattern
Bullish Engulfing:
- First candle: Small red
- Second candle: Large green that completely engulfs first
- Appears at bottom of downtrend
- Strong reversal signal
Bearish Engulfing:
- First candle: Small green
- Second candle: Large red that completely engulfs first
- Appears at top of uptrend
- Strong reversal signal
Why It Works:
Complete rejection of previous sentiment. Power shift.
2. Tweezer Tops/Bottoms
Tweezer Top:
- Two candles with same high
- At top of uptrend
- Shows resistance
- Bearish reversal
Tweezer Bottom:
- Two candles with same low
- At bottom of downtrend
- Shows support
- Bullish reversal
3. Piercing Pattern / Dark Cloud Cover
Piercing Pattern (Bullish):
- First candle: Large red
- Second candle: Green that opens below close, closes above 50% of first
- At bottom of downtrend
- Bullish reversal
Dark Cloud Cover (Bearish):
- First candle: Large green
- Second candle: Red that opens above close, closes below 50% of first
- At top of uptrend
- Bearish reversal
Three-Candlestick Patterns
1. Morning Star (Bullish)
Structure:
- First candle: Large red (downtrend continues)
- Second candle: Small body (indecision)
- Third candle: Large green (reversal confirmed)
Psychology:
Downtrend → Pause → Reversal
Trading:
Enter on close of third candle, stop below low.
2. Evening Star (Bearish)
Structure:
- First candle: Large green (uptrend continues)
- Second candle: Small body (indecision)
- Third candle: Large red (reversal confirmed)
Psychology:
Uptrend → Pause → Reversal
Trading:
Enter on close of third candle, stop above high.
3. Three White Soldiers (Bullish)
Structure:
- Three consecutive large green candles
- Each opens within previous body
- Each closes near high
- Strong upward momentum
Trading:
Continuation pattern. Trend is strong.
4. Three Black Crows (Bearish)
Structure:
- Three consecutive large red candles
- Each opens within previous body
- Each closes near low
- Strong downward momentum
Trading:
Continuation pattern. Downtrend is strong.
Candlestick Patterns + Context
Critical Rule:
Candlestick patterns don't work in isolation. Context is everything.
Context Checklist:
- Trend — Is this with or against the trend?
- Support/Resistance — Is pattern at key level?
- Volume — Is there volume confirmation?
- Timeframe — Higher timeframe = more reliable
- Market Conditions — Trending or ranging?
Example:
Hammer at support in uptrend with volume = High probability
Hammer in middle of range with no volume = Low probability
AI-Enhanced Candlestick Analysis
What AI Adds:
1. Pattern Recognition at Scale
- Scan thousands of charts instantly
- Identify patterns you'd miss
- Rank by probability
2. Historical Success Rate
- "This pattern worked 68% of the time in similar conditions"
- Data-driven confidence
- Removes guesswork
3. Context Analysis
- AI checks trend, volume, support/resistance automatically
- Filters low-probability setups
- Shows only high-quality patterns
4. Multi-Timeframe Confirmation
- Checks if pattern aligns across timeframes
- Higher probability when multiple timeframes agree
Candlestick Trading Rules
Rule 1: Confirmation is Key
Never trade a pattern alone. Wait for:
- Next candle confirmation
- Volume confirmation
- Support/resistance alignment
Rule 2: Bigger Timeframe = More Reliable
- Daily patterns > 1H patterns
- Weekly patterns > Daily patterns
- Use lower timeframes for entry, higher for direction
Rule 3: Trend is Your Friend
- Reversal patterns against strong trend = risky
- Continuation patterns with trend = higher probability
- Wait for trend confirmation before reversals
Rule 4: Volume Validates
- Bullish pattern with high volume = strong
- Bearish pattern with low volume = weak
- Volume confirms conviction
Rule 5: Location Matters
- Patterns at support/resistance = powerful
- Patterns in middle of nowhere = ignore
- Context determines significance
Common Candlestick Mistakes
- Trading Every Pattern — Not all patterns are equal. Be selective.
- Ignoring Trend — Fighting the trend with reversal patterns. Respect the trend.
- No Confirmation — Entering on pattern alone. Wait for confirmation.
- Wrong Timeframe — Trading 5-minute patterns. Use higher timeframes.
- Forgetting Volume — Ignoring volume. Volume validates patterns.
Candlestick Pattern Cheat Sheet
Bullish Reversal:
- Hammer
- Bullish Engulfing
- Morning Star
- Piercing Pattern
- Tweezer Bottom
Bearish Reversal:
- Shooting Star
- Bearish Engulfing
- Evening Star
- Dark Cloud Cover
- Tweezer Top
Continuation:
- Three White Soldiers (bullish)
- Three Black Crows (bearish)
- Marubozu (direction of candle)
Indecision:
- Doji
- Spinning Top
- High Wave
Key Takeaways
- Candlesticks reveal market psychology and battle between bulls and bears
- Context (trend, S/R, volume) determines pattern significance
- Always wait for confirmation before trading patterns
- Higher timeframes produce more reliable patterns
- AI can enhance pattern recognition but doesn't replace understanding
Your Turn
What's your favorite candlestick pattern?
Do you wait for confirmation or trade patterns immediately?
Have you noticed certain patterns working better in specific markets?
Share your candlestick experience below 👇

The Institutional Grade Trading Ecosystem, Built to win trades 📈
Get Access 👇
jackofalltrades.vip 🌐
t.me/jackofalltradesvip 🃏
Get Access 👇
jackofalltrades.vip 🌐
t.me/jackofalltradesvip 🃏
免责声明
这些信息和出版物并非旨在提供,也不构成TradingView提供或认可的任何形式的财务、投资、交易或其他类型的建议或推荐。请阅读使用条款了解更多信息。
The Institutional Grade Trading Ecosystem, Built to win trades 📈
Get Access 👇
jackofalltrades.vip 🌐
t.me/jackofalltradesvip 🃏
Get Access 👇
jackofalltrades.vip 🌐
t.me/jackofalltradesvip 🃏
免责声明
这些信息和出版物并非旨在提供,也不构成TradingView提供或认可的任何形式的财务、投资、交易或其他类型的建议或推荐。请阅读使用条款了解更多信息。