
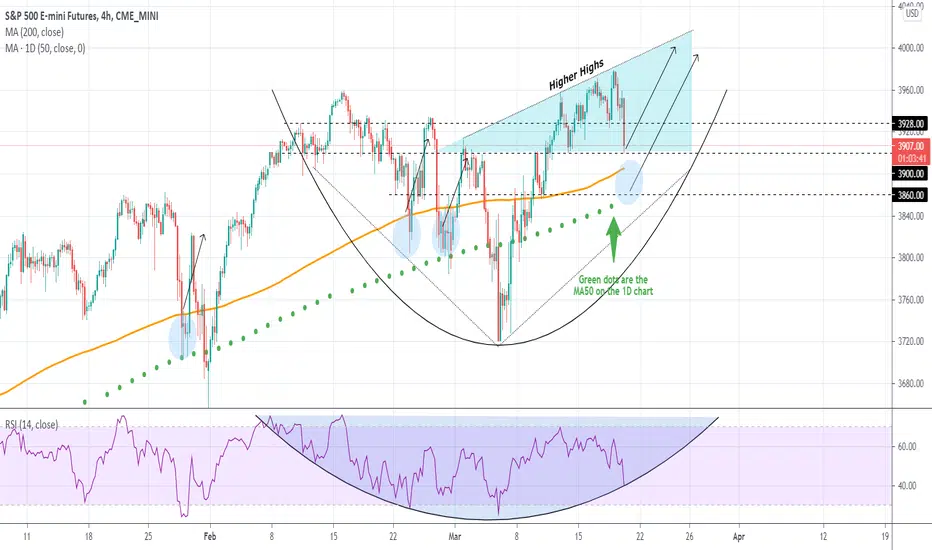
The 4H MA200 (orange trend-line) with the 1D MA50 (green dots) have recently provided rebounds on S&P500 more often than not, acting as a Support Zone.
As you see on the chart those happen to be also on key horizontal Support levels (3900 - 3860). With the 4H RSI making contact with its parabolic line, it is possible that the index is nearing a Support that will provide at least a short-term rebound. Use the Higher Highs line for a potential Target.
** Please support this idea with your likes and comments, it is the best way to keep it relevant and support me. **
--------------------------------------------------------------------------------------------------------
!! Donations via TradingView coins also help me a great deal at posting more free trading content and signals here !!
🎉 👍 Shout-out to TradingShot's 💰 top TradingView Coin donor 💰 this week ==> xBTala
--------------------------------------------------------------------------------------------------------

🚀 I Trade Crypto, Stocks, Indices & Commodities on Bitbase | 1k+ pairs,Low fees,One account! Signup👉 bitbase.com/pro/TRADINGSHOT
💰Message me @ t.me/tradingshot for Account Management|+20% monthly profit| Min. capital $30k|Low Risk
💰Message me @ t.me/tradingshot for Account Management|+20% monthly profit| Min. capital $30k|Low Risk
免责声明
这些信息和出版物并非旨在提供,也不构成TradingView提供或认可的任何形式的财务、投资、交易或其他类型的建议或推荐。请阅读使用条款了解更多信息。