
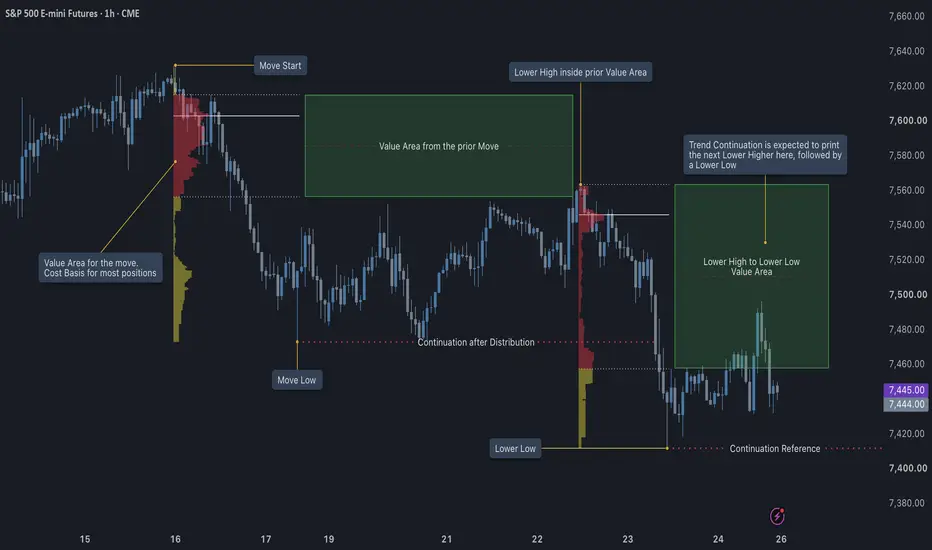
Most volume analysis stops at "was there a lot of it." That is only half the question — the more useful one is where it happened, not just how much.
Two Ways to Measure Volume
A volume histogram under a price chart measures participation across time: how much traded during this candle, this hour, this session. It answers a real question, but a limited one. Volume distribution — the same volume, measured across price instead of time — answers a different one: not how much traded, but exactly where. Plot every transaction by the price it occurred at, and a shape emerges: certain prices attracted far more activity than others. That concentration is not visible on a time-based histogram at all.
A Record, Not a Calculation
Most tools applied to a chart are derivatives — a moving average is a calculation performed on price, an oscillator is a transformation of price over a lookback period. Volume distribution is neither. It is a direct record of where transactions actually occurred. A price level that shows heavy concentration on the distribution is a price level where real participants, in real size, actually did business. That fact does not depend on interpretation, and it does not change with market conditions, session phase, or which indicator is fashionable that year. It is simply what happened.
The Period Changes the Story
The same tool tells a different story depending on how much history it covers. A distribution built from today's session alone shows where today's participants have concentrated so far. One built from the past week shows where a broader, more intermediate pool of participants has been active. One built from the past month shows where the largest, slowest-moving positions have been built. None of these is more correct than the others — they are answering different questions. A level that matters to someone holding for an afternoon is not necessarily the level that matters to someone holding for a month, and using the wrong period produces a level that is technically accurate but irrelevant to the decision actually being made.
The Underlying Principle
Price tells you where the market has been. Volume distribution tells you where the market actually agreed. The two are not the same question, and only one of them is a genuine record rather than an inference.
Two Ways to Measure Volume
A volume histogram under a price chart measures participation across time: how much traded during this candle, this hour, this session. It answers a real question, but a limited one. Volume distribution — the same volume, measured across price instead of time — answers a different one: not how much traded, but exactly where. Plot every transaction by the price it occurred at, and a shape emerges: certain prices attracted far more activity than others. That concentration is not visible on a time-based histogram at all.
A Record, Not a Calculation
Most tools applied to a chart are derivatives — a moving average is a calculation performed on price, an oscillator is a transformation of price over a lookback period. Volume distribution is neither. It is a direct record of where transactions actually occurred. A price level that shows heavy concentration on the distribution is a price level where real participants, in real size, actually did business. That fact does not depend on interpretation, and it does not change with market conditions, session phase, or which indicator is fashionable that year. It is simply what happened.
The Period Changes the Story
The same tool tells a different story depending on how much history it covers. A distribution built from today's session alone shows where today's participants have concentrated so far. One built from the past week shows where a broader, more intermediate pool of participants has been active. One built from the past month shows where the largest, slowest-moving positions have been built. None of these is more correct than the others — they are answering different questions. A level that matters to someone holding for an afternoon is not necessarily the level that matters to someone holding for a month, and using the wrong period produces a level that is technically accurate but irrelevant to the decision actually being made.
The Underlying Principle
Price tells you where the market has been. Volume distribution tells you where the market actually agreed. The two are not the same question, and only one of them is a genuine record rather than an inference.

相关出版物
免责声明
这些信息和出版物并非旨在提供,也不构成TradingView提供或认可的任何形式的财务、投资、交易或其他类型的建议或推荐。请阅读使用条款了解更多信息。