
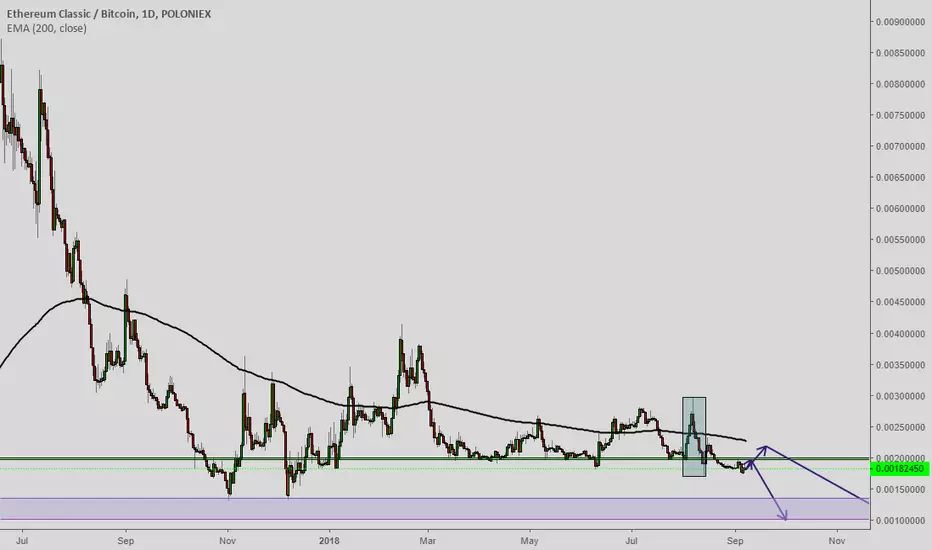
The blueish rectangle showing very peculiar price action which took place on the first half of august. This strong bullish movement was wiped out with couple of days and pull it down below the most important support/resistance level for this pair which is 0.02.
I can see 2 possible scenarios the pair will be pull down by 200 EMA on 4H chart and most likely 0.02 level will no be breached or Pair will do another attempt to go above mentioned level and then it will be pulled down by 200 EMA towards 0.01.
If my scenario is correct ETCBTC should stop for while around 0.013700 and then try to reach 0.01.
The pinkish rectangle refers to strong support/resistance area when closing short position is not a bad idea.
I can see 2 possible scenarios the pair will be pull down by 200 EMA on 4H chart and most likely 0.02 level will no be breached or Pair will do another attempt to go above mentioned level and then it will be pulled down by 200 EMA towards 0.01.
If my scenario is correct ETCBTC should stop for while around 0.013700 and then try to reach 0.01.
The pinkish rectangle refers to strong support/resistance area when closing short position is not a bad idea.

相关出版物
免责声明
这些信息和出版物并非旨在提供,也不构成TradingView提供或认可的任何形式的财务、投资、交易或其他类型的建议或推荐。请阅读使用条款了解更多信息。