
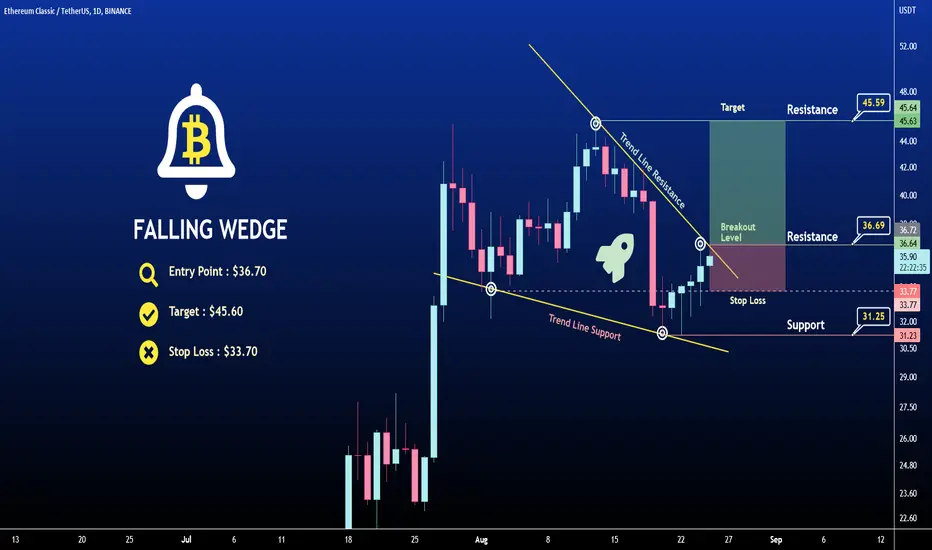
The above chart of Ethereum Classic (ETC) laid out the falling wedge pattern. In a falling wedge pattern, both the upper trend line which connects the highs and the lower trend line which connects the lows converge downwards. The wedge pattern in general indicates a trend reversal. Especially, the falling wedge signals a bullish reversal.
This pattern indicates a breakout in the price trend towards an upswing. From the above chart, we can interpret that the momentum of the downtrend is slowing down.
Currently, Ethereum Classic (ETC) is in the range of $35.80. If the pattern continues, the price of Ethereum Classic (ETC)might reach the resistance levels of $45.60 If the trend reverses, then the price of Ethereum Classic (ETC) may fall to $33.70
✅Trade Level
Entry Point : $36.70
Target : $45.60
Stop Loss : $33.70
Happy Trading
This pattern indicates a breakout in the price trend towards an upswing. From the above chart, we can interpret that the momentum of the downtrend is slowing down.
Currently, Ethereum Classic (ETC) is in the range of $35.80. If the pattern continues, the price of Ethereum Classic (ETC)might reach the resistance levels of $45.60 If the trend reverses, then the price of Ethereum Classic (ETC) may fall to $33.70
✅Trade Level
Entry Point : $36.70
Target : $45.60
Stop Loss : $33.70
Happy Trading

相关出版物
免责声明
这些信息和出版物并非旨在提供,也不构成TradingView提供或认可的任何形式的财务、投资、交易或其他类型的建议或推荐。请阅读使用条款了解更多信息。