
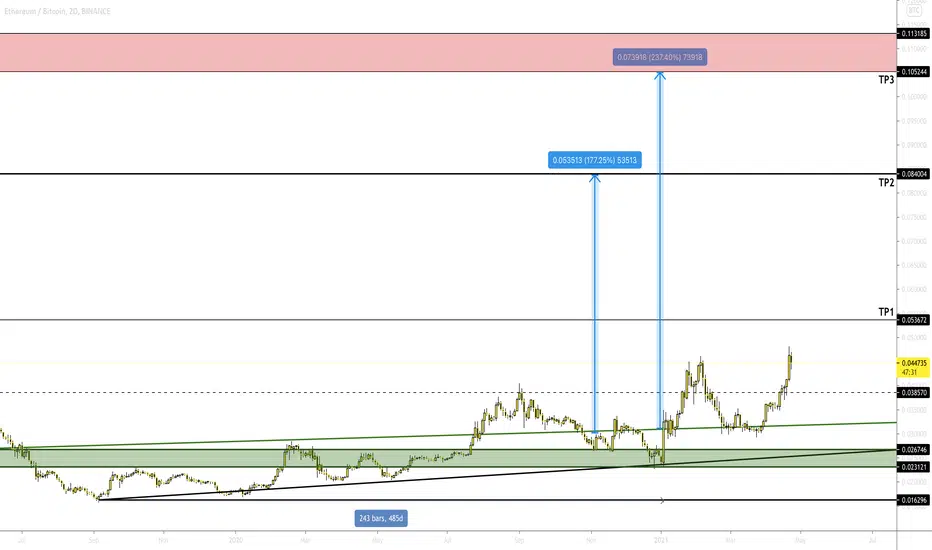
Pretty simple chart, 3 TP levels placed at swing highs created from the previous altcoin season in 2017 - early 2018.
Bottom is 0.016296 and was created on Sept. 6th, 2019. This was also the same date that the BTC.D ratio topped out at 72.04% and has been falling ever since.
Since that day, the ETH/BTC ratio has been slowly gaining in sat value, although it did take 485 days to break out of the 0.026746 resistance level which is now turned support. From here, ETH was quick to shoot up to the 0.038 TP level as well as gain this green trend line (formed 3 years ago form the 2017 high) as support.
This is obviously in a bullish momentum and here are my price targets moving forward:
TP1 🎯 0.053672
TP2 🎯 0.084004
TP3 🎯 0.105244
Bottom is 0.016296 and was created on Sept. 6th, 2019. This was also the same date that the BTC.D ratio topped out at 72.04% and has been falling ever since.
Since that day, the ETH/BTC ratio has been slowly gaining in sat value, although it did take 485 days to break out of the 0.026746 resistance level which is now turned support. From here, ETH was quick to shoot up to the 0.038 TP level as well as gain this green trend line (formed 3 years ago form the 2017 high) as support.
This is obviously in a bullish momentum and here are my price targets moving forward:
TP1 🎯 0.053672
TP2 🎯 0.084004
TP3 🎯 0.105244

🎯 Join my public cryptocurrency trading channel | t.me/easylootcrypto
相关出版物
免责声明
这些信息和出版物并非旨在提供,也不构成TradingView提供或认可的任何形式的财务、投资、交易或其他类型的建议或推荐。请阅读使用条款了解更多信息。
🎯 Join my public cryptocurrency trading channel | t.me/easylootcrypto
相关出版物
免责声明
这些信息和出版物并非旨在提供,也不构成TradingView提供或认可的任何形式的财务、投资、交易或其他类型的建议或推荐。请阅读使用条款了解更多信息。