
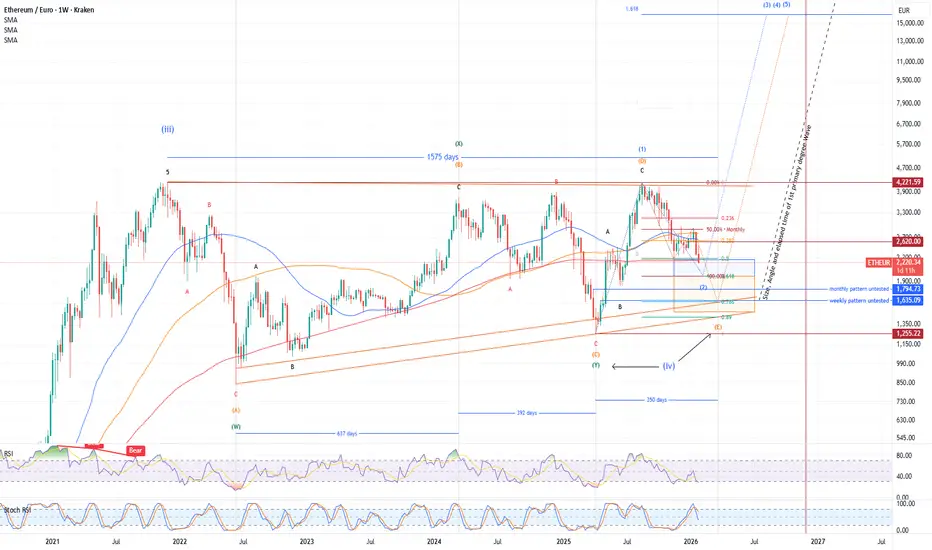
Almost exactly five months after Part III (published mid-August 2025 and updated November 2025), where I nailed the retracement scenario following the completion of the prior impulsive structure, Ethereum continues to respect the larger corrective framework I've been tracking.
Current Snapshot (as of late January 2026)
Key Technical Update
The probability of a temporary breach below €2,000 remains extremely high in the short term. This would fulfill the final leg of the multi-year correction.
The overall structure still qualifies as a complex WXY corrective wave (2), holding firmly above critical Fibonacci levels so far. However, a decisive break and close below the 61.8% retracement would re-label this final decline as wave (E) of an extended ABCDE triangle (or diagonal in some interpretations) — a classic exhaustion pattern that often precedes explosive resolutions.
This isn't just another dip; it's the culmination of a 4+ year sideways-to-down corrective phase following the 2021 blow-off top. Corrections of this magnitude and duration in major assets are rare — and historically, their endings mark the true start of the next macro bull leg.
What Comes Next?
Once this final capitulation prints (likely via a spike low into the €1,800–€1,994 zone or slightly below), expect a swift reversal. The pent-up momentum from years of consolidation, combined with Ethereum's fundamentals (scaling progress, institutional adoption, ETF flows, etc.), sets the stage for a move of historic proportions.
I'm looking at an outcome similar — or potentially even more extreme — than the parabolic run XRP delivered last year. Think multi-fold gains in compressed time, with the kind of velocity that rewrites charts and shakes doubters.
Patience has been the name of the game. The waiting is nearly over.
Stay sharp, manage risk on any final flush, and prepare for what could be the most spectacular chapter yet in Ethereum's journey.
Current Snapshot (as of late January 2026)
- ETH/EUR is hovering in the low €2,200s (recent range €2,215–€2,360), down significantly from the €2,500+ levels seen earlier this month.
- Monthly RSI(7) has plunged to ~28.50 — oversold territory and aligning precisely with the pattern I anticipated back on November 17, 2025, targeting the completion near the 1,994.58 level.
Key Technical Update
The probability of a temporary breach below €2,000 remains extremely high in the short term. This would fulfill the final leg of the multi-year correction.
The overall structure still qualifies as a complex WXY corrective wave (2), holding firmly above critical Fibonacci levels so far. However, a decisive break and close below the 61.8% retracement would re-label this final decline as wave (E) of an extended ABCDE triangle (or diagonal in some interpretations) — a classic exhaustion pattern that often precedes explosive resolutions.
This isn't just another dip; it's the culmination of a 4+ year sideways-to-down corrective phase following the 2021 blow-off top. Corrections of this magnitude and duration in major assets are rare — and historically, their endings mark the true start of the next macro bull leg.
What Comes Next?
Once this final capitulation prints (likely via a spike low into the €1,800–€1,994 zone or slightly below), expect a swift reversal. The pent-up momentum from years of consolidation, combined with Ethereum's fundamentals (scaling progress, institutional adoption, ETF flows, etc.), sets the stage for a move of historic proportions.
I'm looking at an outcome similar — or potentially even more extreme — than the parabolic run XRP delivered last year. Think multi-fold gains in compressed time, with the kind of velocity that rewrites charts and shakes doubters.
Patience has been the name of the game. The waiting is nearly over.
Stay sharp, manage risk on any final flush, and prepare for what could be the most spectacular chapter yet in Ethereum's journey.
注释
The monthly candle pattern (the famous “trio” setup) activated on April 1, 2025, at €1,794.73 had remained untested until recently. It has now finally been tested—just as the weekly level was tested before at €2,318.00, as expected. What's next? 2 posible escenarios are now on the table:
- pullback to €2,000–€2,300 before we potentially reach the end of this correction by testing the last untested weekly pattern at €1,635.09
- The retracement has finished and the new bull cycle will start soon
注释
The "trio" setup has now fully played out exactly as anticipated! The monthly candle pattern (famous “trio” setup) activated on April 1, 2025, at €1,794.73 was tested recently.
Then, the third and final one—the weekly level at €1,635.09—has also been tested, with price reaching as low as **€1,631.32** (or very close on some exchanges, confirming the zone hit during this sharp February 2026 leg down).
All three levels in the sequence have now been tested, just like predicted in the original analysis and updates.
**What's next?**
I expect stabilization here, awaiting a reversal pattern such as a rounded bottom, lateralization/range formation, or other bullish structures to develop. However, it's still possible for price to dip further into the €1,600–€1,500 area if selling pressure persists.
The time frame for the reversal to start: **2–3 weeks +/-**.
Stay tuned—watch volume, support holds, and momentum indicators closely for confirmation.
Source:
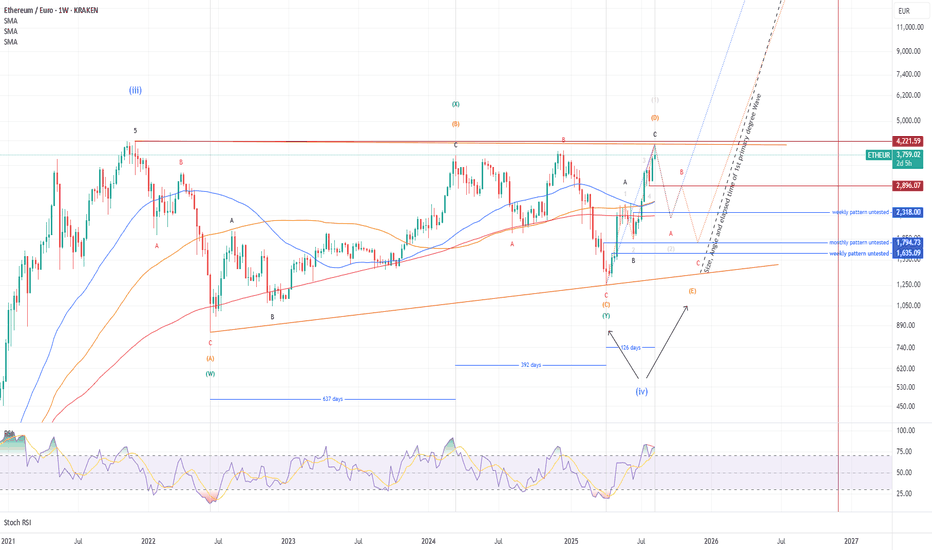
注释
注释
We're almost done, extreme overselling on a weekly basis. Now it's just a matter of time (February/March).注释
As expected, Ethereum has apparently started the new bull cycle and activated its first weekly bullish pattern with a target of 2.171€. To confirm the bullish momentum, Ethereum must close the ongoing weekly candle above 2.029€. Should this happen, a second weekly bullish pattern would then be activated with a target of 2.775€. On the other hand, a break below 1.528€ would reset the bullish momentum and open the possibility of falling below 1.484€.注释
As expected, Ethereum has entered the new bull cycle and successfully activated its first weekly bullish pattern, with a target at **2.171€**.The ongoing weekly candle was unfortunately not able to close above the required confirmation level of **2.029€** at that time. However, the overall bullish cycle remains fully intact and undamaged.
We now have a fresh opportunity: the current weekly candle shows strength and could close above **2.073,60€**. Such a close would confirm bullish momentum, allow the first activated pattern to advance toward its target at **2.167,30€**, and simultaneously activate the next weekly bullish pattern with a target of **2.777,08€**.
Should this confirmation occur, the final major hurdle on the way higher will be a clear daily candle close above **2.921,21€**. Overcoming this level would open the path for further upside and increase the probability of reaching the maximum annual target for 2025 at **4.221€**.
The structure continues to develop constructively. Patience is still required, but the waiting phase appears to be gradually coming to an end. Risk management remains essential — watch the weekly close closely in the coming days.

免责声明
这些信息和出版物并非旨在提供,也不构成TradingView提供或认可的任何形式的财务、投资、交易或其他类型的建议或推荐。请阅读使用条款了解更多信息。
免责声明
这些信息和出版物并非旨在提供,也不构成TradingView提供或认可的任何形式的财务、投资、交易或其他类型的建议或推荐。请阅读使用条款了解更多信息。